


ABSTRACT
We present a 0.8–5 μm spectral library of 210 cool stars observed at a resolving power of R ≡ λ/Δλ ∼ 2000 with the medium-resolution infrared spectrograph, SpeX, at the 3.0 m NASA Infrared Telescope Facility (IRTF) on Mauna Kea, Hawaii. The stars have well-established MK spectral classifications and are mostly restricted to near-solar metallicities. The sample not only contains the F, G, K, and M spectral types with luminosity classes between I and V, but also includes some AGB, carbon, and S stars. In contrast to some other spectral libraries, the continuum shape of the spectra is measured and preserved in the data reduction process. The spectra are absolutely flux calibrated using the Two Micron All Sky Survey photometry. Potential uses of the library include studying the physics of cool stars, classifying and studying embedded young clusters and optically obscured regions of the Galaxy, evolutionary population synthesis to study unresolved stellar populations in optically obscured regions of galaxies and synthetic photometry. The library is available in digital form from the IRTF Web site.
Export citation and abstract BibTeX RIS
1. INTRODUCTION
Spectral libraries play an important role in attempts to understand and classify individual stellar sources as well as to decompose the integrated spectrum of an aggregate system, such as a galaxy, into its various stellar populations. For example, the most widely used stellar classification process, as originally developed by Morgan et al. (1943), consists of comparing the spectrum of a star against a set of reference stellar spectra (for a review see Garrison 1994). Infrared spectral libraries are particularly useful for studying the physics of cool stars (e.g., Joyce et al. 1998; Gautschy-Loidl et al. 2004), classifying and studying stars in nearby embedded young clusters (e.g., Greene & Meyer 1995; Peterson et al. 2008) and optically obscured regions of the Galaxy (e.g., Figer et al. 1995; Frogel et al. 2001; Kurtev et al. 2007, for evolved, globular, and young clusters, respectively), and studying the unresolved stellar populations of optically obscured extragalactic regions using evolutionary population synthesis (EPS; e.g., Lançon et al. 2007; Riffel et al. 2008). EPS techniques attempt to simulate observed galaxy spectra by combining individual stellar spectra from a library and thereby derive the chemical and evolutionary properties of the unresolved stellar populations (e.g., Fioc & Rocca-Volmerange 1997; Leitherer et al. 1999; Bruzual & Charlot 2003; Maraston 2005; Bruzual 2007; Ramos Almeida et al. 2009).
The niche of near-infrared (NIR ∼ 1–5 μm) spectral classification is clear. While stars earlier than roughly M0 (∼3800 K) are brighter at optical wavelengths, unobscured stars later than about M0 are brighter in the NIR and are thus better characterized at these wavelengths. Furthermore, it makes sense to use infrared diagnostics only when optical extinction compromises optical diagnostics. The optimum infrared wavelengths for observation depend on the amount of extinction. For some objects, such as young stellar objects or evolved stars, the presence of circumstellar dust can result in significant excess continuum emission longward of 2 μm. For this reason the J and H bands are perhaps best to characterize embedded young stars since they avoid the veiling due to warm dust in the K band, while at the same time taking advantage of the reduced extinction relative to the optical (e.g., Meyer et al. 1998). On the other hand, heavily obscured objects without veiling are better characterized in the K band, or even the L' band in extreme cases. Consequently, the ideal infrared spectral library should contain spectra covering a wide range of wavelengths to satisfy a variety of possible applications.
With the maturing of NIR spectrographs and detector arrays, it has become possible to generate increasingly sophisticated NIR libraries of stellar spectra. Ivanov et al. (2004) presented a compilation of NIR spectral libraries available at that time. In Table 1 we revise and update this list. (The list does not include spectral libraries covering mostly L and T dwarfs. For our purposes a "library" is assumed to contain more than ten objects.) All of these libraries have shortcomings since none of them contains a large sample of stars, with a range of metallicities, covering all spectral types and luminosity classes, with spectra spanning a large wavelength range. In light of this, we have undertaken a project to construct an improved spectral library using the facility NIR spectrograph, SpeX, at the 3.0 m NASA Infrared Telescope Facility (IRTF) on Mauna Kea, Hawaii. The result of this work is the IRTF Spectral Library, which we are presenting in a series of papers. In the first paper of this series, Cushing et al. (2005) presented the spectra of M, L, and T dwarfs. The current paper presents 210 spectra of F, G, K, and M stars with luminosity classes between I and V (with mostly near-solar metallicities), and includes some asymptotic giant branch (AGB) stars, carbon stars, and S stars. The spectra of all of these stars, including the 13 L dwarfs and two T dwarfs from Cushing et al. (2005), and the gas giant planets (spectra summed along the central meridian) are available in digital form on the IRTF Web site.4 Additional papers on hot stars are currently in preparation.
Table 1. Near-IR Spectral Libraries
| Spectral Library Reference | λ (μm) | Spectral Type | Luminosity Class | Number of Stars | Resolving Power |
|---|---|---|---|---|---|
| Johnson & Méndez (1970) | 1.2–2.5 | A−M | I−V | 32 | 550 |
| Kleinmann & Hall (1986) | 2.0–2.5 | F−M | I−V | 26 | 2500–3100 |
| Lambert et al. (1986) | 1.5–2.5 | C | 30 | 75,000 | |
| McGregor et al. (1988) | 1.0–2.5 | Be, Ae | I | 13 | 500 |
| Tanaka et al. (1990) | 1.5–2.5 | C | 33 | 2000 | |
| Terndrup et al. (1991) | 0.45–2.45 | M | III | 32 | 1000 |
| Lançon & Rocca-Volmerange (1992) | 1.4–2.5 | O−M | I−V | 56 | 550 |
| Origlia et al. (1993) | 1.5–1.7 | G−M | I−V | 40 | 1500 |
| Lazaro et al. (1994) | 1.1–4.2 | C | 15 | 500 | |
| Ali et al. (1995) | 2.0–2.4 | F−M | V | 33 | 1380 |
| Oudmaijer et al. (1995) | 2.1–2.4 | post-AGB | 18 | 400–700, ∼1500 | |
| Dallier et al. (1996) | 1.57–1.64 | O−M | I−V | 37 | 1500–2000 |
| Hanson et al. (1996) | 2.0–2.4 | O−B | I−V | 180 | 800–3000 |
| Jones et al. (1996) | 1.16–1.22 | M | V | 13 | 1085 |
| Morris et al. (1996) | 1.45–2.4 | WR, O, B, LBV | I | 26 | 570–1600 |
| Wallace & Hinkle (1996) | 2.02–2.41 | G−M | I−V | 12 | 45000 |
| Blum et al. (1997) | 1.5–1.8 | O−B | I−V | 11 | 575 |
| Figer et al. (1997) | 2.0–2.4 | WR | 38 | 525 | |
| Ramírez et al. (1997) | 2.19–2.34 | K−M | III | 43 | 1380, 4830 |
| Wallace & Hinkle (1997) | 2.0–2.4 | O−M | I−V | 115 | 3000 |
| Joyce (1998) | 1.0–4.1 | C | 29 | ∼500 | |
| Joyce et al. (1998) | 1.0–1.3 | M, S, C AGB | III | 103 | 1100 |
| Meyer et al. (1998) | 1.5–1.7 | O−M | I−V | 85 | 3000 |
| Pickles (1998) (compilation) | 0.15–2.5 | O−M | I−V | 131 | 50–6000 |
| Förster Schreiber (2000) | 1.95–2.45 | G−M | I−III | 31 | 830, 3000 |
| Lançon & Wood (2000) | 0.5–2.5 | K−M, AGB | I−III | 77 | 1100 |
| Wallace et al. (2000) | 1.05–1.34 | O−M | I−V | 88 | 3000 |
| Frogel et al. (2001) | 2.17–2.34 | RGB | 129 | 1500 | |
| Lenorzer et al. (2002) | 2.36–4.05 | O−B | I−V | 75 | 1500–2000 |
| Malkan et al. (2002) | 1.08–1.35 | O−M | I−V | 105 | 650 |
| Vandenbussche et al. (2002) | 2.36–4.05 | O−M | I−V | 293 | 1500–2000 |
| Wallace & Hinkle (2002) | 3.3–4.2 | G−M, AGB | I−V | 42 | 3000 |
| Ivanov et al. (2004) | 1.48–2.45 | G−M | I−V | 218 | 2000–3000 |
| Ranade et al. (2004) | 1.5–1.8 | O5−M3 | I−V | 135 | 1000 |
| Cushing et al. (2005) | 0.8–4.2 | M, L, T | V | 30 | 940–2000 |
| Lodieu et al. (2005) | 0.6–1.0, 1.0–2.5 | M6−L2 | V | 71 | 600 |
| Hanson et al. (2005) | 1.6–2.2 | O−B | I−V | 37 | 8000–12000 |
| Ranada et al. (2007) | 2.0–2.2 | O7−M7 | I−V | 114 | 1000 |
| van Loon et al. (2008) | 2.9–4.1 | C, AGB, RSG | 50 | 200–400 | |
| Ranade et al. (2007) | 1.1–1.3 | O5−M8 | I−V | 125 | 1000 |
| Venkata Raman & Anandarao (2008) | 1.5–1.8, 2.0–2.4 | AGB | 78 | 1000 | |
| Mármol-Queraltó et al. (2008) | 2.1–2.4 | O−M | I−V | 220 | 2500 |
| Rayner et al. (this work) | 0.8–5 | F−M, S, C, AGB | I−V | 212 | 2000, 2500 |
Download table as: ASCIITypeset image
There are several important features of the IRTF Spectral Library. The wide wavelength range of ∼0.8–5 μm (with a larger subset at 0.8–2.4 μm) is covered in only two cross-dispersed instrument settings. For each setting, several spectral orders are simultaneously recorded during a single exposure. In addition, most of the spectral orders in each setting have significant wavelength overlap with the adjacent spectral orders. These instrumental aspects minimize potential calibration problems posed by stitching together multiple nonoverlapping wavelength ranges observed at different times (e.g., sequentially), a situation typically encountered with observations obtained with non-cross-dispersed (single-order) spectrographs. The signal-to-noise ratio (S/N) is better than ∼100 across most of this range (except for the regions of poor atmospheric transmission and for λ>4 μm) and the resolving powers of R ≡ λ/Δλ≈ 2000 at 0.8–2.4 μm, and R≈ 2500 at 2.4–5 μm, enable the accurate measurement of spectral type and luminosity class using established equivalent width (EW) and line ratio criteria (see Section 3.1). In contrast to some other NIR spectral libraries, the continuum shape is preserved during data reduction (for details see Section 2.3), which is particularly useful for characterizing cool stars with strong molecular absorption bands that have been observed at low resolution R ∼ 100. Preserving the continuum shape also allows for absolute flux calibration by scaling the spectra to published Two Micron All Sky Survey photometry (2MASS; Skrutskie et al. 2006) and for the computation of synthetic colors (e.g., Y − J, J − H, H − K, and K − L').
2. OBSERVATIONS AND DATA REDUCTION
2.1. Sample Selection
As described by Morgan & Keenan (1973), the MK spectral classification system "is a phenomenology of spectral lines, blends, and bands, based on a general progression of color index (abscissa) and luminosity (ordinate). It is defined by an array of standard stars located on a two-dimensional spectral type versus luminosity-class diagram. These standard reference points do not depend on specific line intensities or ratios of intensities; they have come to be defined by the totality of lines, blends, and bands in the ordinary photographic region" (emphasis added). In the MK system, the classification gives the spectral subtype and luminosity class (e.g., K0 III); this is the observational analogue to the projection on the luminosity-temperature plane (H–R diagram) for stars of a particular composition. Abundance adds a third dimension to the two-dimensional MK diagram and is represented by additional symbols determined by the relative intensities of lines or bands that reveal compositional differences from the Sun. For example, as a means of distinguishing a solar metallicity Population I giant K0 III star from one with a lower metal/hydrogen abundance, the classification of the latter becomes K0 III CN-1 or K0 III CN-2 (e.g., Morgan & Keenan 1973). With better quality spectra, increased precision in spectral classification is possible. For example, giants can often be subdivided into luminosity subclasses IIIa, IIIab, and IIIb. A fundamental characteristic of the MK system is that a finite array of discrete cells (spectral types) represents a continuum; i.e., spectra of stars of a given spectral subtype (e.g., K5 V) are not all identical. The precision attainable with MK classification has been estimated to be ±0.6 spectral subtypes for B and A dwarfs by Jaschek & Jaschek (1973) and ±0.65 spectral subtypes for G and K dwarfs by Gliese (1971). This precision depends upon observational dispersion (heterogeneous group of observers and instruments) and cosmic dispersion (e.g., chemical composition effects and rotation effects).
We attempted to construct a sample of stars with undisputed spectral types, traceable to the original developers of the MK classification system. The original MK standard stars (Johnson & Morgan 1953; Morgan & Keenan 1973) are generally too bright for us to observe. To that end, for the majority of the sample, we chose stars with classifications given by Morgan & Abt (1973), Morgan & Keenan (1973), Morgan et al. (1978), Keenan & McNeil (1989), Keenan & Newsom (2000),5 which in several cases were supplemented by stars taken from compilations of MK standard stars by Garcia (1989) and Jaschek (1978). Whenever references gave conflicting classifications, we chose the most recent revision. For F stars, we supplemented the lists generated from the aforementioned references with stars whose spectral types are given by Gray & Garrison (1989), Gray et al. (2001), and Abt & Morrell (1995). Additionally, for M stars, we included objects with classifications given by Kirkpatrick et al. (1991), Henry et al. (1994), and Kirkpatrick et al. (1997), again deferring to the latest revised classifications whenever conflicting or multiple spectral types were found in the various sources. In a few instances, stars with less certain classifications were observed in order to fill gaps in our coverage of spectral types due to observing limitations.
Despite their known variability in spectral type and relative rarity, we included AGB stars in our sample because their high luminosity makes them important in EPS studies of galaxies. Population synthesis and star counts in clusters indicate that AGB stars contribute more than 50% of the K-band light of stellar populations at 0.1–1 Gyr after an instantaneous burst of star formation (Lançon et al. 1999; Lançon 1999). The AGB phase is also important in providing feedback in the chemical evolution of galaxies. AGB stars are intermediate mass stars (∼0.8–8 M☉), which ascend the AGB in the H–R diagram when helium and hydrogen ignite in shells surrounding their cores (this phase lasts about 2 × 10⁵ yr). Shell burning in young AGB stars is stable but becomes increasingly unstable as the stars become more luminous, which leads to thermal pulsations. These stars are known as thermally pulsating AGB (TPAGB) stars. TPAGB stars are recognizable by a variety of observational criteria by which they are variously named: characteristic spectra (late-M, S, and C stars), pulsating variability (Mira variables, long-period variables), mass loss and maser emission (OH/IR stars). In our sample TPAGB stars are identified by their variability types (L: irregular, SR: semiregular, and M: Mira) given in the General Catalog of Variable Stars (GCVS; Kholopov et al. 1998).6 About 40 TPAGB stars are included in our sample.
Mass loss eventually removes the hydrogen-rich stellar envelope, effectively terminating the TPAGB phase. The central star subsequently evolves to higher temperatures while the circumstellar envelope expands and cools, exposing the star. Ionizing wind and radiation from the star quickly form a planetary nebula (PN). The transition from TPAGB to PN is known as the post-AGB (PAGB) or protoplanetary nebula phase and lasts a few thousand years. Although PAGB stars were not targeted in our sample, several supergiants that were observed have some of the characteristics of PAGB stars (see Section 4.3). (For a comprehensive review of AGB stars see Habing & Olofsson 2003).
In order to obtain a high S/N out into the thermal infrared (∼2.3–5 μm), we selected relatively bright stars. Consequently, they tend to be local and therefore of mostly solar composition. Figure 1(a) shows the distribution of metallicities for stars in our sample with spectroscopic measurements of [Fe/H] (Cayrel de Strobel et al. 1997). The distribution is typical for stars in the solar neighborhood (Nordström et al. 2004).
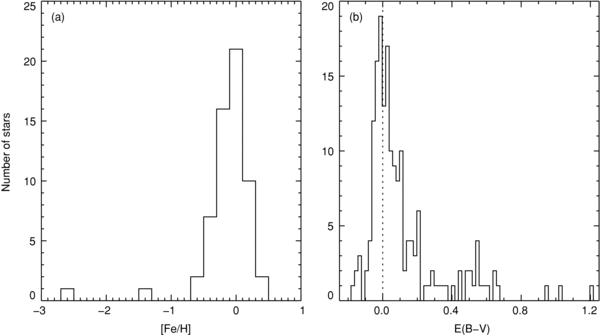
Figure 1. (a) Distribution of metallicities for stars in our sample with spectroscopic measurements of [Fe/H] (61 out of 210, mostly F, G, and K stars) from Cayrel de Strobel et al. (1997). The mean is −0.1 and the dispersion 0.2 dex, which is typical for stars in the solar neighborhood (within 40 pc; Nordström et al. 2004). (b) Distribution of E(B − V) color excesses for the stars in our sample. The width of the peak at negative values indicates that the uncertainty in the color excesses is 0.036 mag.
Download figure:
Standard image High-resolution imageThe object name, spectral classification and associated reference, GCVS variable type, V, B − V, and 2MASS (J, H, and KS) magnitudes for each star in the sample are given in Table 2. All objects in the sample have declinations −30 deg>δ> + 70 deg, a range set by the latitude and declination limit of IRTF, and an airmass < 2 for good telluric correction. The stars have K-band magnitudes of ∼11 >K > 0; the faint limit was set by the desire to obtain high S/N spectra in less than about 30 minutes of integration time, and the bright limit corresponds to detector saturation in the minimum exposure time of 0.1 s (although several brighter targets were observed using ad hoc methods). The total number of stars in the sample is 210. Table 3 gives the composition of the sample by spectral type and luminosity class. Due to practical limitations of observing time, there is no multiepoch coverage of variable stars or large numbers of stars with nonsolar metallicity. However, we anticipate future observing campaigns with SpeX at IRTF will add to the sample.
Table 2. The Sample
| Object | HR Number | Other Name | Spectral Type | Ref. | Variabilitya Type | V b (mag) | B − V b (mag) | J (mag) | H (mag) | Ks (mag) |
|---|---|---|---|---|---|---|---|---|---|---|
| (1) | (2) | (3) | (4) | (5) | (6) | (7) | (8) | (9) | (10) | (11) |
| HD 7927 | HR 382 | ϕ Cas | F0 Ia | 1 | var | 4.987 | 0.680 | 3.751 ± 0.296 | 3.537 ± 0.248 | 3.186 ± 0.268 |
| HD 135153 | HR 5660 | i Lup | F0 Ib−II | 1 | 4.904 | 0.376 | 4.258 ± 0.252 | 4.007 ± 0.194 | 3.991 ± 0.276 | |
| HD 6130 | HR 292 | F0 II | 1 | 5.919 | 0.491 | 4.991 ± 0.274 | 4.690 ± 0.254 | 4.406 ± 0.020 | ||
| HD 89025 | HR 4013 | ζ Leo | F0 IIIa | 1 | var | 3.435 | 0.307 | 2.700 ± 0.232 | 2.628 ± 0.208 | 2.631 ± 0.280 |
| HD 13174 | HR 623 | 14 Ari | F0 III−IVn | 2 | 4.989 | 0.335 | 4.441 ± 0.308 | 4.357 ± 0.240 | 4.062 ± 0.036 | |
| HD 27397 | HR 1351 | h Tau | F0 IV | 1 | DSCTC | 5.593 | 0.283 | 5.002 ± 0.037 | 4.927 ± 0.047 | 4.853 ± 0.015 |
| HD 108519 | F0 V(n) | 1 | 7.705 | 0.273 | 7.093 ± 0.021 | 6.998 ± 0.031 | 6.965 ± 0.040 | |||
| HD 173638 | HR 7055 | F1 II | 1 | *I | 5.710 | 0.595 | 4.213 ± 0.262 | 3.908 ± 0.228 | 3.840 ± 0.298 | |
| HD 213135 | HR 8563 | F1 V | 2 | var | 5.942 | 0.343 | 5.276 ± 0.020 | 5.122 ± 0.027 | 5.031 ± 0.020 | |
| BD +38 2803 | UU Her | F2−F5 Ib | 3 | SRd | 8.190 | 0.090 | 7.635 ± 0.020 | 7.347 ± 0.053 | 7.253 ± 0.018 | |
| HD 182835 | HR 7387 | ν Aql | F2 Ib | 1 | var | 4.660 | 0.593 | 3.109 ± 0.250 | 2.866 ± 0.214 | 2.728 ± 0.224 |
| HD 40535 | HR 2107 | 1 Mon | F2 III−IV | 2 | DSCT | 6.128 | 0.297 | 5.489 ± 0.020 | 5.354 ± 0.029 | 5.281 ± 0.024 |
| HD 164136 | HR 6707 | ν Her | kA9hF2mF2 (IV) | 2 | SRd: | 4.411 | 0.383 | 2.967 ± 0.172 | 2.823 ± 0.168 | 2.771 ± 0.214 |
| HD 113139 | HR 4931 | 78 UMa | F2 V | 1 | var | 4.929 | 0.365 | 4.323 ± 0.282 | 4.166 ± 0.274 | 3.953 ± 0.020 |
| HD 26015 | HR 1279 | F3 V | 1 | var | 6.026 | 0.395 | 5.244 ± 8.888 | 5.055 ± 0.031 | 5.030 ± 0.026 | |
| HD 21770 | HR 1069 | 36 Per | F4 III | 4 | var | 5.312 | 0.401 | 4.696 ± 0.240 | 4.442 ± 0.194 | 4.241 ± 0.036 |
| HD 87822 | HR 3979 | F4 V | 5 | 6.240 | 0.445 | 5.372 ± 0.018 | 5.251 ± 0.033 | 5.131 ± 0.021 | ||
| HD 16232 | HR 764 | 30 Ari B | F4 V | 6 | 7.394 | 0.510 | 6.080 ± 0.020 | 5.908 ± 0.029 | 5.822 ± 0.021 | |
| HD 213306 | HR 8571 | δ Cep | F5 Ib−G1 Ib | 7 | DCEP | 3.562 | 0.480 | 2.865 ± 0.200 | 2.608 ± 0.190 | 2.354 ± 0.216 |
| HD 186155 | HR 7495 | F5 II−III | 1 | var | 5.066 | 0.386 | 4.419 ± 0.254 | 4.219 ± 0.218 | 4.142 ± 0.278 | |
| HD 17918 | HR 856 | F5 III | 8 | 6.295 | 0.471 | 5.430 ± 0.032 | 5.288 ± 0.044 | 5.176 ± 0.021 | ||
| HD 218804 | HR 8825 | 6 And | F5 V | 1 | 5.923 | 0.436 | 5.147 ± 0.236 | 4.738 ± 0.031 | 4.674 ± 0.018 | |
| HD 27524 | F5 V | 1 | 6.800 | 0.436 | 5.970 ± 0.020 | 5.786 ± 0.016 | 5.762 ± 0.020 | |||
| HD 75555 | F5.5 III−IV | 1 | 8.095 | 0.484 | 7.214 ± 0.018 | 7.035 ± 0.016 | 6.992 ± 0.018 | |||
| HD 160365 | HR 6577 | F6 III−IV | 1 | 6.116 | 0.556 | 5.005 ± 0.037 | 4.769 ± 0.020 | 4.697 ± 0.016 | ||
| HD 11443 | HR 544 | α Tri | F6 IV | 1 | ELL | 3.416 | 0.488 | 2.406 ± 0.236 | 2.182 ± 0.206 | 2.274 ± 0.266 |
| HD 215648 | HR 8665 | ξ Peg | F6 V | 1 | var: | 4.197 | 0.502 | 3.358 ± 0.254 | 3.078 ± 0.214 | 2.961 ± 0.286 |
| HD 201078 | HR 8084 | F7 II– | 1 | DCEPS | 5.769 | 0.532 | 4.638 ± 0.256 | 4.390 ± 0.222 | 4.374 ± 0.016 | |
| HD 124850 | HR 5338 | iota Vir | F7 III | 1 | * | 4.079 | 0.514 | 3.140 ± 0.266 | 2.909 ± 0.236 | 2.801 ± 0.266 |
| HD 126660 | HR 5404 | 23 Boo | F7 V | 1 | * | 4.052 | 0.497 | 3.179 ± 0.244 | 2.980 ± 0.216 | 2.739 ± 0.332 |
| HD 190323 | F8 Ia | 1 | var: | 6.834 | 0.874 | 5.269 ± 0.024 | 4.992 ± 0.038 | 4.888 ± 0.018 | ||
| HD 51956 | F8 Ib | 9 | 7.507 | 0.803 | 6.063 ± 0.024 | 5.756 ± 0.033 | 5.612 ± 0.031 | |||
| HD 220657 | HR 8905 | 68 Peg | F8 III | 1 | 4.407 | 0.610 | 3.527 ± 0.266 | 3.230 ± 0.208 | 3.033 ± 0.256 | |
| HD 111844 | F8 IV | 1 | 7.870 | 0.560 | 6.796 ± 0.018 | 6.569 ± 0.017 | 6.524 ± 0.018 | |||
| HD 219623 | HR 8853 | F8 V | 1 | 5.577 | 0.524 | 4.871 ± 0.250 | 4.599 ± 0.190 | 4.306 ± 0.036 | ||
| HD 27383 | 55 Tau | F8 V | 1 | BY: | 6.886 | 0.560 | 5.820 ± 0.018 | 5.588 ± 0.021 | 5.542 ± 0.020 | |
| HD 102870 | HR 4540 | β Vir | F8.5 IV−V | 1 | 3.608 | 0.442 | 2.597 ± 0.252 | 2.363 ± 0.230 | 2.269 ± 0.254 | |
| HD 6903 | HR 339 | ψ3 Psc | F9 IIIa | 10 | 5.550 | 0.689 | 4.565 ± 0.270 | 4.189 ± 0.228 | 4.183 ± 0.348 | |
| HD 176051 | HR 7162 | F9 V | 1 | 5.224 | 0.588 | 3.847 ± 0.254 | 3.611 ± 0.252 | 3.655 ± 0.042 | ||
| HD 165908 | HR 6775 | b Her | F9 V metal weak | 1 | 5.046 | 0.519 | 3.459 ± 0.198 | 3.242 ± 0.190 | 3.107 ± 0.230 | |
| HD 114710 | HR 4983 | β Com | F9.5 V | 10 | BY: | 4.257 | 0.571 | 3.232 ± 0.234 | 2.992 ± 0.192 | 2.923 ± 0.274 |
| HD 185018 | HR 7456 | G0 Ib−II | 11 | 5.978 | 0.881 | 4.364 ± 0.242 | 3.925 ± 0.216 | 3.953 ± 0.036 | ||
| HD 109358 | HR 4785 | β CVn | G0 V | 10 | var | 4.260 | 0.585 | 3.213 ± 0.218 | 2.905 ± 0.198 | 2.848 ± 0.310 |
| HD 74395 | HR 3459 | F Hya | G1 Ib | 11 | 4.628 | 0.840 | 3.194 ± 0.278 | 2.786 ± 0.262 | 2.710 ± 0.300 | |
| HD 216219 | G1 II−III: Fe−1 CH0.5 | 11 | 7.450 | 0.640 | 6.265 ± 0.020 | 6.034 ± 0.021 | 5.935 ± 0.017 | |||
| HD 21018 | HR 1023 | G1 III: CH−1: | 10 | 6.383 | 0.862 | 4.864 ± 0.026 | 4.568 ± 8.888 | 4.357 ± 0.018 | ||
| HD 10307 | HR 483 | G1 V | 10 | 4.958 | 0.618 | 4.000 ± 0.262 | 3.703 ± 0.226 | 3.577 ± 0.314 | ||
| HD 95128 | HR 4277 | 47 UMa | G1− V Fe−0.5 | 10 | 5.049 | 0.606 | 3.960 ± 0.296 | 3.736 ± 0.224 | 3.750 ± 0.340 | |
| HD 20619 | G1.5 V | 10 | 7.049 | 0.656 | 5.876 ± 0.019 | 5.552 ± 0.040 | 5.469 ± 0.021 | |||
| HD 42454 | G2 Ib | 12 | 7.361 | 1.232 | 5.121 ± 0.037 | 4.693 ± 0.036 | 4.598 ± 0.055 | |||
| HD 39949 | G2 Ib | 12 | 7.225 | 1.090 | 5.279 ± 0.035 | 4.814 ± 0.036 | 4.664 ± 0.016 | |||
| HD 3421 | HR 157 | G2 Ib−II | 10 | 5.422 | 0.884 | 3.708 ± 0.208 | 3.320 ± 0.216 | 3.212 ± 0.276 | ||
| HD 219477 | HR 8842 | 61 Peg | G2 II−III | 11 | 6.490 | 0.850 | 5.351 ± 0.248 | 4.771 ± 0.204 | 4.537 ± 8.888 | |
| HD 126868 | HR 5409 | ϕ Vir | G2 IV | 11 | var | 4.810 | 0.698 | 3.541 ± 0.264 | 3.116 ± 0.426 | 3.067 ± 0.306 |
| HD 76151 | HR 3538 | G2 V | 10 | var: | 5.999 | 0.666 | 4.871 ± 0.037 | 4.625 ± 0.276 | 4.456 ± 0.023 | |
| HD 192713 | HR 7741 | 22 Vul | G3 Ib−II Wk H&K comp? | 11 | EA/GS | 5.167 | 1.046 | 3.532 ± 0.244 | 3.130 ± 0.202 | 2.938 ± 0.242 |
| HD 176123 | HR 7164 | G3 II | 11 | 6.37 | 0.990 | 4.651 ± 0.037 | 4.120 ± 0.202 | 4.067 ± 0.322 | ||
| HD 88639 | HR 4006 | G3 IIIb Fe−1 | 10 | var | 6.046 | 0.844 | 4.726 ± 0.250 | 4.226 ± 0.204 | 4.018 ± 0.036 | |
| HD 10697 | HR 508 | 109 Psc | G3 Va | 10 | 6.260 | 0.725 | 5.386 ± 0.268 | 4.678 ± 0.031 | 4.601 ± 0.021 | |
| HD 179821 | G4 O−Ia | 11 | SRd (post-AGB) | 8.145 | 1.555 | 5.371 ± 0.023 | 4.998 ± 0.023 | 4.728 ± 0.020 | ||
| HD 6474 | G4 Ia | 10 | SRd | 7.611 | 1.617 | 4.808 ± 0.354 | 4.199 ± 0.290 | 3.919 ± 0.458 | ||
| HD 94481 | HR 4255 | G4 III−IIIb | 10 | 5.653 | 0.830 | 4.235 ± 0.234 | 3.756 ± 0.224 | 3.745 ± 0.246 | ||
| HD 108477 | HR 4742 | G4 III | 10 | 6.313 | 0.865 | 4.838 ± 0.037 | 4.497 ± 0.232 | 4.271 ± 0.036 | ||
| HD 214850 | HR 8631 | G4 V | 11 | 5.726 | 0.714 | 4.619 ± 0.196 | 4.212 ± 0.180 | 3.937 ± 0.036 | ||
| HD 190113 | G5 Ib | 11 | 7.870 | 1.500 | 5.301 ± 0.029 | 4.777 ± 0.036 | 4.557 ± 0.018 | |||
| HD 18474 | HR 885 | G5: III: CN−3 CH−2 Hδ−1 | 10 | 5.470 | 0.890 | 3.616 ± 0.196 | 3.185 ± 0.158 | 2.975 ± 0.232 | ||
| HD 193896 | HR 7788 | G5 IIIa | 11 | 6.290 | 0.910 | 4.393 ± 0.278 | 3.938 ± 0.270 | 4.139 ± 0.036 | ||
| HD 165185 | HR 6748 | G5 V | 12 | var | 5.944 | 0.618 | 4.835 ± 0.037 | 4.614 ± 0.016 | 4.469 ± 0.016 | |
| HD 161664 | HR 6617 | G6 Ib Hδ1 | 11 | * | 6.180 | 1.490 | 3.520 ± 0.282 | 2.850 ± 0.240 | 2.636 ± 0.280 | |
| HD 202314 | HR 8126 | G6 Ib−IIa Ca1 Ba0.5 | 11 | 6.169 | 1.102 | 4.701 ± 0.222 | 4.098 ± 0.250 | 4.020 ± 0.270 | ||
| HD 58367 | HR 2828 |  CMi CMi |
G6 IIb | 10 | 4.988 | 1.007 | 3.457 ± 0.282 | 2.964 ± 0.224 | 2.826 ± 0.242 | |
| HD 27277 | G6 III | 10 | 8.090 | 0.990 | 6.278 ± 0.030 | 5.785 ± 0.029 | 5.680 ± 0.018 | |||
| HD 115617 | HR 5019 | 61 Vir | G6.5 V | 10 | 4.739 | 0.709 | 3.334 ± 0.200 | 2.974 ± 0.176 | 2.956 ± 0.236 | |
| HD 333385 | BD +29 3865 | G7 Ia | 11 | L | 8.705 | 2.187 | 4.766 ± 0.037 | 4.305 ± 0.214 | 3.793 ± 0.036 | |
| HD 25877 | HR 1270 | G7 II | 10 | 6.316 | 1.161 | 4.444 ± 0.280 | 3.973 ± 0.172 | 3.819 ± 0.220 | ||
| HD 182694 | HR 7382 | G7 IIIa | 11 | 5.862 | 0.924 | 4.437 ± 0.264 | 3.994 ± 0.206 | 3.835 ± 0.286 | ||
| HD 20618 | HR 995 | 59 Ari | G7 IV | 10 | 5.900 | 0.860 | 4.446 ± 0.266 | 4.050 ± 0.220 | 4.106 ± 0.286 | |
| HD 114946 | HR 4995 | 55 Vir | G7 IV | 10 | 5.318 | 0.878 | 3.742 ± 0.238 | 3.169 ± 0.192 | 3.114 ± 0.256 | |
| HD 16139 | G7.5 IIIa | 10 | 8.058 | 1.052 | 6.180 ± 0.026 | 5.707 ± 0.026 | 5.587 ± 0.021 | |||
| HD 208606 | HR 8374 | G8 Ib | 13 | 6.157 | 1.600 | 3.751 ± 0.246 | 3.124 ± 0.188 | 2.811 ± 0.280 | ||
| HD 122563 | HR 5270 | G8: III: Fe−5 | 10 | * | 6.198 | 0.907 | 4.786 ± 0.298 | 4.030 ± 0.234 | 3.731 ± 0.036 | |
| HD 104979 | HR 4608 | ø Vir | G8 III Ba1 CN0.5 CH1 | 10 | 4.117 | 0.982 | 2.543 ± 0.328 | 2.126 ± 0.270 | 2.014 ± 0.270 | |
| HD 135722 | HR 5681 | δ Boo | G8 III Fe−1 | 11 | * | 3.482 | 0.951 | 1.659 ± 0.238 | 0.985 ± 0.192 | 1.223 ± 0.196 |
| HD 101501 | HR 4496 | 61 UMa | G8 V | 10 | var | 5.323 | 0.723 | 3.988 ± 0.242 | 3.648 ± 0.228 | 3.588 ± 0.036 |
| HD 75732 | HR 3522 | ρ1 Cnc | G8 V | 14 | 5.944 | 0.860 | 4.768 ± 0.244 | 4.265 ± 0.234 | 4.015 ± 0.036 | |
| HD 170820 | G9 II CN1 Hδ1 | 11 | 7.371 | 1.575 | 4.469 ± 0.264 | 3.666 ± 0.200 | 3.543 ± 0.232 | |||
| HD 222093 | HR 8958 | G9 III | 11 | 5.652 | 1.023 | 4.205 ± 0.268 | 3.556 ± 0.222 | 3.520 ± 0.214 | ||
| HD 165782 | AX Sgr | K0 Ia | 11 | SRd | 7.680 | 2.140 | 3.791 ± 0.258 | 3.098 ± 0.222 | 2.798 ± 0.254 | |
| HD 44391 | K0 Ib | 12 | 7.740 | 1.400 | 5.301 ± 0.019 | 4.759 ± 0.036 | 4.548 ± 0.017 | |||
| HD 179870 | K0 II | 11 | 7.063 | 1.245 | 4.887 ± 0.034 | 4.048 ± 0.226 | 4.191 ± 0.036 | |||
| HD 100006 | HR 4433 | 86 Leo | K0 III | 15 | 5.525 | 1.059 | 3.970 ± 0.266 | 3.379 ± 0.216 | 3.122 ± 0.330 | |
| HD 145675 | 14 Her | K0 V | 11 | 6.652 | 0.877 | 5.158 ± 0.029 | 4.803 ± 0.016 | 4.714 ± 0.016 | ||
| HD 164349 | HR 6713 | 93 Her | K0.5 IIb | 11 | 4.669 | 1.257 | 2.574 ± 0.282 | 2.033 ± 0.208 | 1.937 ± 0.202 | |
| HD 9852 | K0.5 III CN1 | 10 | 7.930 | 1.460 | 5.339 ± 0.041 | 4.775 ± 0.023 | 4.576 ± 0.015 | |||
| HD 63302 | HR 3026 | QY Pup | K1 Ia−Iab | 10 | SRd | 6.347 | 1.752 | 3.746 ± 0.248 | 2.958 ± 0.224 | 2.702 ± 0.266 |
| HD 36134 | HR 1830 | K1− III Fe−0.5 | 10 | var | 5.778 | 1.156 | 3.903 ± 0.280 | 3.207 ± 0.266 | 3.124 ± 0.276 | |
| HD 91810 | K1− IIIb CN1.5 Ca1 | 10 | 6.550 | 1.170 | 4.998 ± 0.280 | 4.297 ± 0.015 | 4.182 ± 0.344 | |||
| HD 25975 | HR 1277 | 49 Per | K1 III | 4 | 6.089 | 0.944 | 4.599 ± 0.304 | 4.057 ± 0.246 | 4.022 ± 0.366 | |
| HD 165438 | HR 6756 | K1 IV | 11 | 5.766 | 0.967 | 4.376 ± 0.322 | 3.788 ± 0.254 | 3.749 ± 0.228 | ||
| HD 142091 | HR 5901 | 11 CrB | K1 IVa | 11 | 4.812 | 0.996 | 3.035 ± 0.184 | 2.575 ± 0.180 | 2.423 ± 0.242 | |
| HD 10476 | HR 493 | 107 Psc | K1 V | 10 | var | 5.242 | 0.836 | 3.855 ± 0.240 | 3.391 ± 0.226 | 3.285 ± 0.266 |
| HD 124897 | HR 5340 | Arcturus | K1.5 III Fe−0.5 | 11 | var | −0.050 | 1.231 | −2.252 ± 0.157 | −2.810 ± 9.996 | −2.911 ± 0.170 |
| HD 212466 | RW Cep | K2 O−Ia | 11 | SRd | 6.626 | 2.275 | 3.090 ± 0.212 | 2.462 ± 0.192 | 2.027 ± 0.238 | |
| HD 2901 | K2 III Fe−1 | 10 | 6.917 | 1.232 | 5.130 ± 0.300 | 4.250 ± 0.282 | 4.116 ± 0.338 | |||
| HD 132935 | K2 III | 11 | 6.697 | 1.364 | 4.598 ± 0.200 | 3.654 ± 0.208 | 3.590 ± 0.240 | |||
| HD 137759 | HR 5744 | 12 Dra | K2 III | 11 | * | 3.291 | 1.166 | 1.293 ± 0.220 | 0.724 ± 0.146 | 0.671 ± 0.200 |
| HD 3765 | K2 V | 10 | E: | 7.363 | 0.942 | 5.694 ± 0.024 | 5.272 ± 0.051 | 5.164 ± 0.016 | ||
| HD 23082 | K2.5 II | 10 | 7.520 | 1.850 | 3.874 ± 0.190 | 3.116 ± 0.202 | 2.786 ± 0.224 | |||
| HD 187238 | K3 Iab−Ib | 12 | 7.100 | 2.040 | 3.625 ± 0.268 | 2.749 ± 0.204 | 2.418 ± 0.268 | |||
| HD 16068 | K3 II−III | 10 | 7.380 | 1.790 | 4.773 ± 0.264 | 3.868 ± 0.296 | 3.676 ± 0.352 | |||
| HD 221246 | HR 8925 | K3 III | 11 | 6.170 | 1.460 | 3.989 ± 0.280 | 3.177 ± 0.244 | 2.949 ± 0.330 | ||
| HD 178208 | HR 7252 | K3 III | 11 | 6.441 | 1.393 | 4.514 ± 0.262 | 3.820 ± 0.222 | 3.571 ± 0.278 | ||
| HD 35620 | HR 1805 | ϕ Aur | K3 III Fe1 | 10 | 5.079 | 1.403 | 2.905 ± 0.256 | 2.167 ± 0.192 | 2.104 ± 0.262 | |
| HD 99998 | HR 4432 | e Leo | K3+ III Fe−0.5 | 10 | 4.675 | 1.531 | 2.160 ± 0.266 | 1.390 ± 0.244 | 1.247 ± 0.264 | |
| HD 114960 | K3.5 IIIb CN0.5 CH0.5 | 10 | 6.565 | 1.412 | 4.207 ± 0.254 | 3.358 ± 0.242 | 3.339 ± 0.268 | |||
| HD 219134 | HR 8832 | K3 V | 11 | * | 5.567 | 0.994 | 3.981 ± 0.258 | 3.469 ± 0.226 | 3.261 ± 0.304 | |
| HD 185622 | HR 7475 | K4 Ib | 11 | Lc: | 6.376 | 2.026 | 2.138 ± 0.214 | 1.312 ± 0.140 | 0.986 ± 0.166 | |
| HD 201065 | K4 Ib−II | 11 | 7.584 | 1.793 | 4.868 ± 0.256 | 3.939 ± 0.260 | 3.669 ± 0.260 | |||
| HD 207991 | K4− III | 11 | 6.870 | 1.600 | 4.039 ± 0.226 | 3.222 ± 0.210 | 2.923 ± 0.270 | |||
| HD 45977 | K4 V | 16 | 9.140 | 1.120 | 7.079 ± 0.024 | 6.601 ± 0.034 | 6.406 ± 0.018 | |||
| HD 216946 | HR 8726 | K5 Ib | 11 | Lc | 4.969 | 1.773 | 1.792 ± 0.264 | 0.958 ± 0.150 | 0.724 ± 0.178 | |
| HD 181596 | K5 III | 11 | 7.510 | 1.600 | 4.923 ± 0.216 | 4.026 ± 0.190 | 3.817 ± 0.206 | |||
| HD 36003 | K5 V | 10 | 7.640 | 1.113 | 5.615 ± 0.019 | 5.111 ± 0.071 | 4.880 ± 0.024 | |||
| HD 120477 | HR 5200 | υ Boo | K5.5 III | 10 | var | 4.046 | 1.520 | 1.218 ± 0.264 | 0.438 ± 0.180 | 0.435 ± 0.182 |
| HD 3346 | HR 152 | K6 IIIa | 10 | SRs | 5.101 | 1.582 | 2.257 ± 0.282 | 1.375 ± 0.182 | 1.263 ± 0.182 | |
| HD 181475 | K7 IIa | 11 | SRb: | 6.960 | 2.070 | 2.978 ± 0.298 | 2.121 ± 0.252 | 1.816 ± 0.282 | ||
| HD 194193 | HR 7800 | K7 III | 11 | var | 5.926 | 1.612 | 3.129 ± 0.226 | 2.240 ± 0.180 | 1.966 ± 0.264 | |
| HD 237903 | 36 UMa B | K7 V | 13 | 8.691 | 1.352 | 6.119 ± 0.020 | 5.499 ± 0.034 | 5.361 ± 0.016 | ||
| HD 201092 | HR 8086 | 61 Cyg B | K7 V | 11 | IS | 6.055 | 1.354 | 3.546 ± 0.278 | 2.895 ± 0.218 | 2.544 ± 0.328 |
| HD 213893 | M0 IIIb | 11 | 6.691 | 1.534 | 4.009 ± 0.330 | 3.092 ± 0.248 | 2.869 ± 0.274 | |||
| HD 19305 | M0 V | 10 | 9.072 | 1.360 | 6.492 ± 0.021 | 5.843 ± 0.034 | 5.646 ± 0.021 | |||
| HD 236697 | M0.5 Ib | 10 | Lc | 8.630 | 2.157 | 4.860 ± 0.316 | 3.878 ± 0.176 | 3.434 ± 0.358 | ||
| HD 209290 | Gl 846 | M0.5 V | 11 | 9.167 | 1.457 | 6.196 ± 0.023 | 5.562 ± 0.051 | 5.322 ± 0.023 | ||
| HD 339034 | NR Vul | M1 Ia | 13 | Lc | 9.302 | 3.036 | 3.253 ± 0.266 | 2.141 ± 0.222 | 1.691 ± 0.224 | |
| HD 14404 | PR Per | M1− Iab−Ib | 10 | Lc | 7.904 | 2.303 | 3.556 ± 0.312 | 2.682 ± 0.192 | 2.247 ± 0.298 | |
| HD 39801 | HR 2061 | Betelgeuse | M1−M2 Ia−Iab | 10 | SRc | 0.481 | 1.861 | −2.989 ± 0.103 | −4.007 ± 0.162 | −4.378 ± 0.186 |
| HD 204724 | HR 8225 | 2 Peg | M1+ III | 11 | var | 4.554 | 1.618 | 1.701 ± 0.292 | 0.784 ± 0.166 | 0.666 ± 0.182 |
| HD 42581 | Gl 229 A | M1 V | 17 | UV | 8.152 | 1.491 | 5.104 ± 0.037 | 4.393 ± 0.254 | 4.166 ± 0.232 | |
| HD 35601 | M1.5 Iab−Ib | 11 | Lc | 7.350 | 2.200 | 2.930 ± 0.248 | 1.942 ± 0.222 | 1.662 ± 0.234 | ||
| BD +60 265 | M1.5 Ib | 10 | 8.493 | 2.345 | 4.002 ± 0.208 | 3.147 ± 0.162 | 2.625 ± 0.242 | |||
| HD 36395 | Gl 205 | M1.5 V | 17 | BY: | 7.966 | 1.474 | 4.999 ± 0.300 | 4.149 ± 0.212 | 4.039 ± 0.260 | |
| HD 206936 | HR 8316 | μ Cep | M2− Ia | 11 | SRc | 4.104 | 2.327 | −0.326 ± 0.204 | −1.264 ± 0.180 | −1.620 ± 0.160 |
| HD 10465 | M2 Ib | 10 | Lc | 6.816 | 1.860 | 2.658 ± 0.218 | 1.862 ± 0.168 | 1.507 ± 0.194 | ||
| HD 23475 | HR 1155 | BE Cam | M2 II | 10 | Lc | 4.462 | 1.877 | 0.567 ± 0.194 | −0.422 ± 0.158 | −0.650 ± 0.166 |
| HD 120052 | HR 5181 | 87 Vir | M2 III | 11 | var | 5.436 | 1.619 | 1.884 ± 0.252 | 1.018 ± 0.216 | 0.730 ± 0.256 |
| HD 95735 | Gl 411 | M2 V | 17 | BY: | 7.498 | 1.508 | 4.203 ± 0.242 | 3.640 ± 0.202 | 3.254 ± 0.306 | |
| Gl 806 | M2 V | 17 | var | 10.730 | 1.570 | 7.329 ± 0.018 | 6.769 ± 0.023 | 6.533 ± 0.016 | ||
| HD 219734 | HR 8860 | 8 And | M2.5 III Ba0.5 | 11 | var | 4.830 | 1.655 | 1.615 ± 0.198 | 0.539 ± 0.168 | 0.506 ± 0.182 |
| Gl 381 | M2.5 V | 17 | var | 10.640 | 1.573 | 7.021 ± 0.023 | 6.471 ± 0.049 | 6.193 ± 0.026 | ||
| Gl 581 | HO Lib | M2.5 V | 18 | BY | 10.572 | 1.601 | 6.706 ± 0.026 | 6.095 ± 0.033 | 5.837 ± 0.023 | |
| RW Cyg | M3 to M4 Ia−Iab | 11 | SRc | 8.361 | 2.881 | 2.117 ± 0.294 | 0.964 ± 0.152 | 0.640 ± 0.210 | ||
| CD −31 4916 | M3 Iab−Ia | 13 | Lc | 8.878 | 2.238 | 4.612 ± 0.208 | 3.486 ± 0.234 | 3.139 ± 0.246 | ||
| HD 14469 | SU Per | M3−M4 Iab | 10 | SRc | 7.697 | 2.175 | 2.824 ± 0.254 | 1.928 ± 0.184 | 1.455 ± 0.222 | |
| HD 40239 | HR 2091 | π Aur | M3 IIb | 10 | Lc | 4.290 | 1.698 | 0.245 ± 0.220 | −0.602 ± 0.174 | −0.813 ± 0.168 |
| HD 39045 | HR 2018 | M3 III | 10 | Lb: | 6.249 | 1.752 | 2.655 ± 0.300 | 1.698 ± 0.196 | 1.407 ± 0.178 | |
| Gl 388 | AD Leo | M3 V | 18 | UV | 9.421 | 1.544 | 5.449 ± 0.027 | 4.843 ± 0.020 | 4.593 ± 0.017 | |
| HD 14488 | RS Per | M3.5 Iab Fe−1 var? | 10 | SRc | 8.490 | 2.256 | 3.054 ± 0.218 | 2.108 ± 0.192 | 1.562 ± 0.210 | |
| HD 28487 | M3.5 III Ca−0.5 | 10 | SRc: | 6.800 | 1.740 | 2.684 ± 0.304 | 1.784 ± 0.268 | 1.457 ± 0.302 | ||
| Gl 273 | Luyten's Star | M3.5 V | 17 | 9.832 | 1.554 | 5.714 ± 0.032 | 5.219 ± 0.063 | 4.857 ± 0.023 | ||
| HD 19058 | HR 921 | ρ Per | M4+ IIIa | 10 | SRb | 3.390 | 1.646 | −0.779 ± 0.182 | −1.675 ± 0.158 | −1.904 ± 0.152 |
| HD 214665 | HR 8621 | M4+ III | 11 | Lb | 5.090 | 1.580 | 1.087 ± 0.246 | 0.131 ± 0.168 | −0.159 ± 0.174 | |
| HD 4408 | HR 211 | 57 Psc | M4 III | 10 | SRs | 5.341 | 1.616 | 1.441 ± 0.246 | 0.504 ± 0.156 | 0.254 ± 0.168 |
| HD 27598 | DG Eri | M4− III | 11 | SRb | 7.017 | 1.671 | 2.987 ± 0.270 | 2.106 ± 0.230 | 1.847 ± 0.264 | |
| Gl 213 | M4 V | 18 | BY | 11.597 | 1.655 | 7.124 ± 0.021 | 6.627 ± 0.018 | 6.389 ± 0.016 | ||
| Gl 299 | M4 V | 18 | BY: | 12.834 | 1.768 | 8.424 ± 0.023 | 7.927 ± 0.042 | 7.660 ± 0.026 | ||
| HD 204585 | HR 8223 | NV Peg | M4.5 IIIa | 11 | SRb | 5.856 | 1.500 | 1.262 ± 0.280 | 0.260 ± 0.162 | −0.051 ± 0.186 |
| Gl 268AB | QY Aur | M4.5 V | 18 | UV | 11.49 | 1.70 | 6.731 ± 0.026 | 6.152 ± 0.047 | 5.846 ± 0.018 | |
| HD 156014 | HR 6406 | α1 Her A | M5 Ib−II | 11 | SRc | 3.057 | 1.447 | −2.302 ± 0.166 | −3.224 ± 0.174 | −3.511 ± 0.150 |
| HD 175865 | HR 7157 | 13 R Lyr | M5 III | 13 | SRb | 4.026 | 1.588 | −0.738 ± 0.222 | −1.575 ± 0.230 | −1.837 ± 0.208 |
| Gl 51 | M5 V | 17 | UV | 13.78 | 1.68 | 8.611 ± 0.027 | 8.014 ± 0.023 | 7.718 ± 0.020 | ||
| Gl 866ABC | EZ Aqr | M5 V | 18 | UV+BY | 12.33 | 1.96 | 6.553 ± 0.019 | 5.954 ± 0.031 | 5.537 ± 0.020 | |
| HD 94705 | HR 4267 | VY Leo | M5.5 III: | 10 | Lb: | 5.786 | 1.453 | 0.434 ± 0.204 | −0.449 ± 0.248 | −0.762 ± 0.296 |
| HD 196610 | HR 7886 | EU Del | M6 III | 11 | SRb | 6.058 | 1.482 | 0.345 ± 0.206 | −0.774 ± 0.210 | −1.009 ± 0.204 |
| HD 18191 | HR 867 | ρ2 Ari | M6− III: | 10 | SRb | 5.815 | 1.452 | 0.230 ± 0.208 | −0.652 ± 0.200 | −0.868 ± 0.222 |
| Gl 406 | CN Leo | M6 V | 17 | UV | 13.529 | 2.013 | 7.085 ± 0.024 | 6.482 ± 0.042 | 6.084 ± 0.017 | |
| GJ 1111 | DX Cnc | M6.5 V | 18 | UV | 14.824 | 2.066 | 8.235 ± 0.021 | 7.617 ± 0.018 | 7.260 ± 0.024 | |
| HD 14386 | Mira | M5e−M9e III | 19 | M | 4.954 | 1.549 | −0.732 ± 0.149 | −1.574 ± 0.192 | −2.213 ± 0.216 | |
| HD 108849 | BK Vir | M7− III: | 10 | SRb | 7.460 | 1.540 | 0.544 ± 0.186 | −0.376 ± 0.186 | −0.730 ± 0.214 | |
| HD 207076 | EP Aqr | M7− III: | 11 | SRb | 6.686 | 1.491 | −0.296 ± 0.202 | −1.373 ± 0.274 | −1.708 ± 0.376 | |
| Gl 644C | vB 8 | M7 V | 17 | UV | 16.80 | 2.20 | 9.776 ± 0.029 | 9.201 ± 0.024 | 8.816 ± 0.023 | |
| MY Cep | M7−M7.5 I | 19 | SRc | 14.520 | 1.86 | 4.583 ± 0.280 | 2.980 ± 0.242 | 2.138 ± 0.278 | ||
| HD 69243 | HR 3248 | R Cnc | M6e−M9e III | 19 | M | 7.752 | 1.516 | 0.770 ± 0.198 | −0.327 ± 0.156 | −0.705 ± 0.168 |
| BRI B2339 − 0447 | M7 − 8 III | 20 | ... | ... | 9.143 ± 0.023 | 8.174 ± 0.031 | 7.653 ± 0.021 | |||
| IRAS 01037+1219 | WX Psc | M8 III | 19 | M (OH/IR) | ... | ... | 7.437 ± 0.026 | 4.641 ± 0.200 | 2.217 ± 0.298 | |
| Gl 752B | vB 10 | M8 V | 17 | UV: | 17.50 | 2.13 | 9.908 ± 0.025 | 9.226 ± 0.026 | 8.765 ± 0.022 | |
| LP 412 − 31 | M8 V | 21 | ... | ... | 11.759 ± 0.021 | 11.066 ± 0.022 | 10.639 ± 0.018 | |||
| IRAS 21284 − 0747 | HY Aqr | M8 − 9 III | 20 | M | ... | ... | 6.173 ± 0.026 | 5.316 ± 0.026 | 4.757 ± 0.023 | |
| IRAS 14436 − 0703 | AQ Vir | M8 − 9 III | 20 | M | ... | ... | 5.654 ± 0.021 | 4.980 ± 0.016 | 4.497 ± 0.316 | |
| IRAS 14303 − 1042 | M8 − 9 III | 20 | M | ... | ... | 6.502 ± 0.019 | 5.643 ± 0.040 | 4.959 ± 0.021 | ||
| IRAS 15060+0947 | FV Boo | M9 III | 20 | M | ... | ... | 5.450 ± 0.020 | 4.520 ± 0.232 | 3.836 ± 0.272 | |
| BRI B1219 − 1336 | VX Crv | M9 III | 20 | M | ... | ... | 8.659 ± 0.026 | 7.892 ± 0.031 | 7.344 ± 0.021 | |
| DENIS−P J104814.7 | M9 V | 22 | ... | ... | 9.538 ± 0.022 | 8.905 ± 0.044 | 8.447 ± 0.023 | |||
| −395606.1 | ||||||||||
| LP 944 − 20 | M9 V | 23 | ... | ... | 10.725 ± 0.021 | 10.017 ± 0.021 | 9.548 ± 0.023 | |||
| LHS 2065 | M9 V | 17 | UV | 18.85 | ... | 11.212 ± 0.026 | 10.469 ± 0.026 | 9.942 ± 0.024 | ||
| LHS 2924 | M9 V | 17 | UV | 19.58 | ... | 11.990 ± 0.021 | 11.225 ± 0.029 | 10.744 ± 0.024 | ||
| BRI B0021 − 0214 | M9.5 V | 23 | BY | ... | ... | 11.992 ± 0.035 | 11.084 ± 0.022 | 10.539 ± 0.023 | ||
| IRAS 14086 − 0703 | IO Vir | M10+ III | 20 | ... | ... | 6.645 ± 0.019 | 4.861 ± 0.286 | 3.587 ± 0.356 | ||
| HD 142143 | V* ST Her | M6.5S to M7S III: | 11 | SRb | ... | ... | 0.743 ± 0.242 | −0.137 ± 0.210 | −0.542 ± 0.206 | |
| BD +44 2267 | AV CVn | S2.5 Zr 2 | 24 | Lb | 9.801 | 1.886 | 6.278 ± 0.035 | 5.431 ± 0.061 | 5.157 ± 0.018 | |
| HD 64332 | NQ Pup | S4.5 Zr 2 Ti 4 | 10 | Lb | 7.550 | 1.730 | 3.542 ± 0.292 | 2.587 ± 0.212 | 2.306 ± 0.274 | |
| HD 44544 | FU Mon | SC5.5 Zr 0.5 | 24 | SR | 8.945 | 3.085 | 3.395 ± 0.236 | 2.101 ± 0.204 | 1.675 ± 0.226 | |
| HD 62164 | SU Mon | S5−S6 Zr 3 to 4 Ti 0 | 10 | SRb | 8.250 | 2.600 | 2.805 ± 0.258 | 1.705 ± 0.242 | 1.257 ± 0.298 | |
| HD 76846 | C−R2+ IIIa: C2 2.5 | 10 | 9.350 | 1.390 | 7.354 ± 0.020 | 6.812 ± 0.023 | 6.636 ± 0.016 | |||
| HD 31996 | HR 1607 | R Lep | C7, 6e(N4) | 19 | M | 8.081 | 5.699 | 2.160 ± 0.268 | 0.884 ± 0.224 | 0.137 ± 0.244 |
| HD 44984 | HR 2308 | BL Ori | C−N4 C2 3.5 | 10 | Lb | 6.215 | 2.341 | 2.192 ± 0.324 | 1.006 ± 0.190 | 0.770 ± 0.196 |
| HD 76221 | HR 3541 | X Cnc | C−N 4.5 C2 5.5 MS 3 | 10 | SRb | 6.647 | 3.365 | 1.569 ± 0.236 | 0.489 ± 0.186 | 0.063 ± 0.194 |
| HD 92055 | HR 4163 | U Hya | C−N4.5 C2 4.5 | 10 | SRb | 4.955 | 2.662 | 0.803 ± 0.248 | −0.254 ± 0.322 | −0.716 ± 0.362 |
| HD 70138 | C−J4.5 IIIa: C2 6 j 6 | 10 | Lb: | 9.420 | 1.667 | 5.809 ± 0.023 | 4.899 ± 0.021 | 4.382 ± 0.018 | ||
| HD 48664 | CZ Mon | C−N5 C2 6 | 10 | Lb | 9.450 | 3.190 | 4.327 ± 0.260 | 3.039 ± 0.202 | 2.434 ± 0.234 | |
| HD 57160 | BM Gem | C−J5− C2 5− j 4 | 10 | SRb | ... | ... | 4.398 ± 0.232 | 3.304 ± 0.210 | 2.728 ± 0.254 |
Notes. aVariability type from the General Catalog of Variable Stars (Kholopov et al. 1998). The variability type is described in http://www.sai.msu.su/groups/cluster/gcvs/gcvs/iii/vartype.txt. bV and B − V values are primarily from Mermilliod (2006) and are augmented with values from Kharchenko (2001), Beauchamp et al. (1994), and Leggett (1992). References. (1) Gray et al. 2001; (2) Gray & Garrison 1989; (3) Rosino 1951; (4) Roman 1955; (5) Abt 1981; (6) Cowley 1976; (7) Kraft 1960; (8) Morgan & Keenan 1973; (9) MacConnell & Bidelman 1976; (10) Keenan & Newsom 2000; (11) Keenan & McNeil 1989; (12) Jaschek 1978; (13) Garcia 1989; (14) Cowley et al. 1967; (15) Kharchenko 2001; (16) Upgren et al. 1972; (17) Kirkpatrick et al. 1991; (18) Henry et al. 1994; (19) Kholopov et al. 1998; (20) Kirkpatrick et al. 1997; (21) Kirkpatrick et al. 1995; (22) Delfosse et al. 2001; (23) Kirkpatrick et al. 1999; (24) Ake 1979.
Table 3. Spectral Composition of Library
| Spectral | Luminosity Class | |||||
|---|---|---|---|---|---|---|
| Type | 0 | I | II | III | IV | V |
| F | 0 | 7 | 4 | 10 | 5 | 15 |
| G | 1 | 12 | 6 | 13 | 3 | 11 |
| K | 1 | 7 | 5 | 19 | 2 | 8 |
| M | 0 | 14 | 2 | 27 | 0 | 25 |
| S | ... | ... | ... | 5 | ... | ... |
| C | ... | ... | ... | 8 | ... | ... |
Download table as: ASCIITypeset image
2.2. Observations
The observations were carried out over a period of eight years using SpeX at the IRTF. A detailed description of SpeX is given by Rayner et al. (2003). Briefly, SpeX is a 0.8–5.4 μm, medium-resolution, cross-dispersed spectrograph equipped with a 1024 × 1024 Aladdin 3 InSb array. The entire 0.8–5.4 μm wavelength range can be covered with two cross-dispersed modes: the short-wavelength cross-dispersed mode (SXD) and the long-wavelength cross-dispersed mode (LXD). The SXD mode provides simultaneous coverage of the 0.8–2.42 μm wavelength range, except for a 0.06 μm gap between the H and K bands, while the LXD1.9, LXD2.1, and LXD2.3 modes cover the 1.9–4.2, 2.20–5.0, and 2.38–5.4 μm wavelength ranges, respectively. For nearly all stars, the 0 3 (2 pixel) slit was used for both the SXD and LXD modes, providing resolving powers of 2000 and 2500, respectively. Measurements of arc lines obtained with the internal calibration unit indicate that the FWHM is 2 pixels at all wavelengths for the 03 slit. (The resolving power R varies by ∼20% across a spectral order since it depends on the changing grating diffraction angle.) The length of the slit for these modes is 150 and the spatial scale is 015 pixel−1. The spectrograph also includes a high-throughput low-resolution R∼ 200 prism mode and a single-order 60'' long-slit R∼ 2000 mode. An autonomous infrared slit viewer employing a 512 × 512 Aladdin 2 InSb array is used for object acquisition, guiding, and imaging photometry. The slit viewer covers a 60'' × 60'' field of view at a spatial scale of 012 pixel−1. An internal K-mirror image rotator enables the field to be rotated on the slit. Calibration observations are obtained using the internal calibration unit consisting of flat field and arc lamps, integrating sphere, and illumination optics that reproduce the beam from the telescope. A log of the observations including the object name, spectral type, UT date of observation, spectroscopic mode, resolving power, exposure time, associated telluric standard star, and sky conditions is presented in Table 4.
Table 4. Log of SpeX Observations
| Object | Spectral Type | UT Date | Spectroscopy Mode | R | Exp. Time (sec) | A0 V Standard | Sky Conditions |
|---|---|---|---|---|---|---|---|
| (1) | (2) | (3) | (4) | (5) | (6) | (7) | (8) |
| HD 7927 | F0 Ia | 2005 Oct 6 | SXD | 2000 | 120 | HD 12365 | Clear |
| 2005 Oct 6 | LXD1.9 | 2500 | 150 | HD 12365 | Clear | ||
| HD 135153 | F0 Ib−II | 2007 Jun 24 | SXD | 2000 | 96 | HD 146624 | Clear |
| 2007 Jun 24 | LXD2.1 | 2500 | 300 | HD 146624 | Clear | ||
| HD 6130 | F0 II | 2001 Sep 1 | SXD | 2000 | 100 | HD 12365 | Thin Cirrus |
| 2001 Sep 1 | LXD1.9 | 2500 | 200 | HD 12365 | Thin Cirrus | ||
| HD 89025 | F0 IIIa | 2007 Apr 25 | SXD | 2000 | 100 | HD 88960 | Clear |
| 2007 Apr 25 | LXD1.9 | 2500 | 200 | HD 88960 | Clear | ||
| HD 13174 | F0 III−IVn | 2003 Oct 16 | SXD | 2000 | 150 | HD 16811 | Thin Cirrus |
| 2003 Oct 16 | LXD2.1 | 2500 | 300 | HD 16811 | Thin Cirrus | ||
| HD 27397 | F0 IV | 2005 Oct 6 | SXD | 2000 | 120 | HD 31295 | Clear |
| 2005 Oct 6 | LXD2.1 | 2500 | 300 | HD 31295 | Clear | ||
| HD 108519 | F0 V(n) | 2007 Jun 24 | SXD | 2000 | 480 | HD 107655 | Clear |
| 2007 Jun 24 | LXD1.9 | 2500 | 600 | HD 107655 | Thin Cirrus | ||
| HD 173638 | F1 II | 2008 Oct 8 | SXD | 2000 | 120 | HD 171149 | Thin Cirrus |
| 2008 Oct 12 | LXD2.1 | 2500 | 300 | HD 171149 | Thin Cirrus | ||
| HD 213135 | F1 V | 2008 Oct 8 | SXD | 2000 | 180 | HD 212643 | Thin Cirrus |
| 2008 Oct 12 | LXD1.9 | 2500 | 450 | HD 212643 | Thin Cirrus | ||
| BD +38 2803 | F2−F5 Ib | 2003 Aug 10 | SXD | 2000 | 720 | HD 157778 | Clear |
| 2003 Aug 10 | LXD2.1 | 2500 | 600 | HD 157778 | Clear | ||
| HD 182835 | F2 Ib | 2003 Oct 16 | SXD | 2000 | 200 | HD 177724 | Thin Cirrus |
| HD 40535 | F2 III−IV | 2006 Dec 21 | SXD | 2000 | 150 | HD 45380 | Clear |
| 2006 Dec 21 | LXD2.1 | 2500 | 300 | HD 45380 | Clear | ||
| HD 164136 | kA9hF2mF2 (IV) | 2005 Oct 6 | SXD | 2000 | 120 | HD 165029 | Clear |
| 2001 Sep 1 | LXD1.9 | 2500 | 100 | HD 174567 | Thin Cirrus | ||
| HD 113139 | F2 V | 2002 May 29 | SXD | 2000 | 210 | HD 118214 | Clear |
| 2002 May 29 | LXD2.1 | 2500 | 250 | HD 118214 | Clear | ||
| HD 26015 | F3 V | 2000 Oct 24 | SXD | 2000 | 200 | HD 23258 | Clear |
| 2005 Oct 7 | LXD2.1 | 2500 | 300 | HD 21686 | Clear | ||
| HD 21770 | F4 III | 2006 Dec 21 | SXD | 2000 | 150 | HD 21038 | Clear |
| 2006 Dec 21 | LXD2.1 | 2500 | 300 | HD 21038 | Clear | ||
| HD 87822 | F4 V | 2001 Mar 10 | SXD | 2000 | 300 | HD 88960 | Thin Cirrus |
| 2001 Mar 10 | LXD2.3 | 2500 | 500 | HD 88960 | Thin Cirrus | ||
| HD 16232 | F4 V | 2001 Aug 6 | SXD | 2000 | 60 | HD 13869 | Clear |
| 2003 Oct 6 | LXD2.1 | 2500 | 250 | HD 16811 | Thin Cirrus | ||
| HD 213306 | F5 Ib − G1 Ib | 2003 Oct 16 | SXD | 2000 | 140 | HD 223386 | Thin Cirrus |
| 2003 Oct 16 | LXD2.1 | 2500 | 60 | HD 223386 | Thin Cirrus | ||
| HD 186155 | F5 II−III | 2001 Aug 31 | SXD | 2000 | 90 | HD 192538 | Thin Cirrus |
| 2001 Aug 31 | LXD1.9 | 2500 | 250 | HD 192538 | Thin Cirrus | ||
| HD 17918 | F5 III | 2000 Oct 24 | SXD | 2000 | 200 | HD 16811 | Clear |
| 2000 Oct 25 | LXD2.3 | 2500 | 300 | HD 16811 | Clear | ||
| HD 218804 | F5 V | 2001 Oct 20 | SXD | 2000 | 225 | HD 219290 | Thin Cirrus |
| 2001 Oct 20 | LXD1.9 | 2500 | 200 | HD 219290 | Thin Cirrus | ||
| HD 27524 | F5 V | 2003 Jan 14 | SXD | 2000 | 120 | HD 25175 | Clear |
| 2003 Sep 21 | LXD2.1 | 2500 | 300 | HD 25175 | Clear | ||
| HD 75555 | F5.5 III−IV | 2007 Apr 25 | SXD | 2000 | 600 | HD 71906 | Clear |
| HD 160365 | F6 III−IV | 2003 Jul 7 | SXD | 2000 | 100 | HD 165029 | Thin Cirrus |
| 2003 Jul 7 | LXD2.1 | 2500 | 300 | HD 165029 | Thin Cirrus | ||
| HD 11443 | F6 IV | 2005 Oct 7 | SXD | 2000 | 61 | HD 13869 | Clear |
| 2005 Oct 7 | LXD2.1 | 2500 | 150 | HD 13869 | Clear | ||
| HD 215648 | F6 V | 2008 Oct 8 | SXD | 2000 | 180 | HD 210501 | Thin Cirrus |
| HD 201078 | F7 II– | 2008 Oct 11 | SXD | 2000 | 360 | HD 196724 | Thick Cirrus |
| HD 124850 | F7 III | 2007 Apr 25 | SXD | 2000 | 120 | HD 126129 | Clear |
| HD 126660 | F7 V | 2007 Jun 22 | SXD | 2000 | 120 | HD 121409 | Clear |
| 2007 Jun 22 | LXD2.1 | 2500 | 400 | HD 121409 | Clear | ||
| HD 190323 | F8 Ia | 2008 Oct 8 | SXD | 2000 | 160 | HD 196724 | Thin Cirrus |
| 2008 Oct 8 | LXD2.1 | 2500 | 300 | HD 196724 | Thin Cirrus | ||
| HD 51956 | F8 Ib | 2003 Oct 16 | SXD | 2000 | 200 | HD 53205 | Thin Cirrus |
| 2006 Dec 21 | LXD2.1 | 2500 | 300 | HD 60357 | Clear | ||
| HD 220657 | F8 III | 2006 Dec 21 | SXD | 2000 | 90 | HD 222749 | Clear |
| 2008 Oct 12 | LXD1.9 | 2500 | 150 | HD 210501 | Thin Cirrus | ||
| HD 111844 | F8 IV | 2007 Apr 25 | SXD | 2000 | 360 | HD 107655 | Clear |
| HD 219623 | F8 V | 2001 Oct 20 | SXD | 2000 | 105 | HD 219290 | Thin Cirrus |
| 2001 Oct 20 | LXD1.9 | 2500 | 200 | HD 219290 | Thin Cirrus | ||
| HD 27383 | F8 V | 2000 Oct 24 | SXD | 2000 | 150 | HD 23258 | Clear |
| 2000 Oct 25 | LXD2.3 | 2500 | 300 | HD 23258 | Clear | ||
| HD 102870 | F8.5 IV−V | 2007 Apr 25 | SXD | 2000 | 120 | HD 97585 | Clear |
| 2007 Apr 25 | LXD1.9 | 2500 | 180 | HD 97585 | Clear | ||
| HD 6903 | F9 IIIa | 2001 Aug 29 | SXD | 2000 | 120 | HD 6457 | Clear |
| 2001 Aug 31 | LXD1.9 | 2500 | 200 | HD 13869 | Thin Cirrus | ||
| HD 176051 | F9 V | 2001 Oct 11 | SXD | 2000 | 180 | HD 174567 | Clear |
| 2004 Jul 6 | LXD1.9 | 2500 | 150 | HD 174567 | Clear | ||
| HD 165908 | F9 V metal weak | 2003 Aug 10 | SXD | 2000 | 40 | HD 171623 | Clear |
| 2003 Aug 10 | LXD2.1 | 2500 | 300 | HD 171623 | Clear | ||
| HD 114710 | F9.5 V | 2004 Apr 30 | SXD | 2000 | 100 | HD 121996 | Clear |
| 2004 Apr 30 | LXD2.1 | 2500 | 150 | HD 121996 | Clear | ||
| HD 185018 | G0 Ib−II | 2001 Oct 11 | SXD | 2000 | 72 | HD 182919 | Clear |
| 2003 Oct 7 | LXD2.1 | 2500 | 250 | HD 182919 | Clear | ||
| HD 109358 | G0 V | 2007 Jun 24 | SXD | 2000 | 120 | HD 109615 | Clear |
| 2007 Jun 24 | LXD2.1 | 2500 | 200 | HD 109615 | Clear | ||
| HD 74395 | G1 Ib | 2003 Jan 14 | SXD | 2000 | 126 | HD 71155 | Clear |
| 2003 Nov 20 | LXD1.9 | 2500 | 150 | HD 71155 | Clear | ||
| HD 216219 | G1 II−III: Fe−1 CH0.5 | 2005 Oct 6 | SXD | 2000 | 300 | HD 210501 | Clear |
| 2005 Oct 7 | LXD2.1 | 2500 | 300 | HD 208108 | Clear | ||
| HD 21018 | G1 III: CH−1: | 2005 Oct 6 | SXD | 2000 | 135 | HD 21686 | Clear |
| 2005 Oct 6 | LXD2.1 | 2500 | 300 | HD 21686 | Clear | ||
| HD 10307 | G1 V | 2006 Dec 21 | SXD | 2000 | 120 | HD 13869 | Clear |
| 2006 Dec 21 | LXD2.1 | 2500 | 300 | HD 13689 | Clear | ||
| HD 95128 | G1− V Fe−0.5 | 2001 Mar 10 | SXD | 2000 | 150 | HD 88960 | Thin Cirrus |
| 2003 May 7 | LXD1.9 | 2500 | 300 | HD 88960 | Thin Cirrus | ||
| HD 20619 | G1.5 V | 2001 Jan 25 | SXD | 2000 | 300 | HD 21686 | Thin Cirrus |
| 2001 Jan 25 | LXD2.3 | 2500 | 300 | HD 21686 | Thin Cirrus | ||
| HD 42454 | G2 Ib | 2001 Oct 12 | SXD | 2000 | 180 | HD 46553 | Clear |
| HD 39949 | G2 Ib | 2001 Oct 12 | SXD | 2000 | 180 | HD 46553 | Clear |
| HD 3421 | G2 Ib−II | 2005 Oct 7 | SXD | 2000 | 150 | HD 7215 | Clear |
| 2005 Oct 7 | LXD2.1 | 2500 | 300 | HD 7215 | Clear | ||
| HD 219477 | G2 II−III | 2008 Oct 12 | SXD | 2000 | 180 | HD 210501 | Thin Cirrus |
| HD 126868 | G2 IV | 2007 Jun 24 | SXD | 2000 | 150 | HD 126129 | Clear |
| 2007 Jun 24 | LXD2.1 | 2500 | 150 | HD 126129 | Clear | ||
| HD 76151 | G2 V | 2000 Dec 11 | SXD | 2000 | 180 | HD 71155 | Clear |
| 2000 Dec 11 | LXD2.3 | 1500 | 250 | HD 71155 | Clear | ||
| HD 192713 | G3 Ib−II Wk H&K comp? | 2005 Oct 6 | SXD | 2000 | 225 | HD 196724 | Clear |
| 2005 Oct 7 | LXD2.1 | 2500 | 300 | HD 196724 | Clear | ||
| HD 176123 | G3 II | 2005 Jun 22 | SXD | 2000 | 140 | HD 182110 | Thin Cirrus |
| 2004 Jul 4 | LXD1.9 | 2500 | 150 | HD 182678 | Clear | ||
| HD 88639 | G3 IIIb Fe−1 | 2003 Feb 25 | SXD | 2000 | 84 | HD 88960 | Clear |
| 2003 May 7 | LXD1.9 | 2500 | 300 | HD 88960 | Thin Cirrus | ||
| HD 10697 | G3 Va | 2000 Oct 24 | SXD | 2000 | 100 | HD 6457 | Clear |
| 2000 Oct 25 | LXD2.3 | 2500 | 300 | HD 6457 | Clear | ||
| HD 179821 | G4 O−Ia | 2001 Oct 11 | SXD | 2000 | 180 | HD 171149 | Clear |
| 2005 Aug 26 | LXD2.1 | 2500 | 300 | HD 177724 | Clear | ||
| HD 6474 | G4 Ia | 2003 Aug 10 | SXD | 2000 | 135 | HD 11946 | Clear |
| 2003 Aug 10 | LXD2.1 | 2500 | 300 | HD 11946 | Clear | ||
| HD 94481 | G4 III−IIIb | 2003 Feb 25 | SXD | 2000 | 120 | HD 92245 | Clear |
| HD 108477 | G4 III | 2003 Feb 25 | SXD | 2000 | 144 | HD 105764 | Clear |
| 2003 May 8 | LXD2.1 | 2500 | 300 | HD 112304 | Clear | ||
| HD 214850 | G4 V | 2004 Jul 5 | SXD | 2000 | 160 | HD 210501 | Clear |
| 2001 Aug 6 | LXD2.1 | 2500 | 400 | HD 208108 | Clear | ||
| HD 190113 | G5 Ib | 2001 Oct 11 | SXD | 2000 | 120 | HD 192538 | Clear |
| 2001 Oct 19 | LXD1.9 | 2500 | 240 | HD 192538 | Thin Cirrus | ||
| HD 18474 | G5: III: CN−3 CH−2 Hδ−1 | 2006 Dec 21 | SXD | 2000 | 125 | HD 21038 | Clear |
| 2006 Dec 21 | LXD2.1 | 2500 | 300 | HD 21038 | Clear | ||
| HD 193896 | G5 IIIa | 2003 Oct 16 | SXD | 2000 | 200 | HD 190454 | Thin Cirrus |
| HD 165185 | G5 V | 2003 Jul 7 | SXD | 2000 | 150 | HD 157486 | Thin Cirrus |
| 2003 Jul 7 | LXD2.1 | 2500 | 300 | HD 157486 | Thin Cirrus | ||
| HD 161664 | G6 Ib Hδ1 | 2003 Aug 5 | SXD | 2000 | 125 | HD 170364 | Thin Cirrus |
| 2004 Jul 5 | LXD1.9 | 2500 | 300 | HD 155379 | Clear | ||
| HD 202314 | G6 Ib−IIa Ca1 Ba0.5 | 2005 Oct 6 | SXD | 2000 | 300 | HD 208108 | Clear |
| 2005 Oct 7 | LXD2.1 | 2500 | 300 | HD 196724 | Clear | ||
| HD 58367 | G6 IIb | 2003 Jan 14 | SXD | 2000 | 150 | HD 50931 | Clear |
| 2004 Mar 9 | LXD2.3 | 2500 | 300 | HD 64648 | Clear | ||
| HD 27277 | G6 III | 2005 Oct 7 | SXD | 2000 | 160 | HD 29526 | Clear |
| 2005 Oct 7 | LXD2.1 | 2500 | 300 | HD 29526 | Clear | ||
| HD 115617 | G6.5 V | 2002 May 29 | SXD | 2000 | 120 | HD 112304 | Clear |
| 2002 May 29 | LXD2.1 | 2500 | 250 | HD 112304 | Clear | ||
| HD 333385 | G7 Ia | 2002 Jul 13 | SXD | 2000 | 200 | HD 192538 | Clear |
| 2004 Jul 5 | LXD1.9 | 2500 | 300 | HD 196724 | Clear | ||
| HD 25877 | G7 II | 2005 Oct 6 | SXD | 2000 | 120 | HD 34787 | Clear |
| 2005 Oct 6 | LXD2.1 | 2500 | 300 | HD 34787 | Clear | ||
| HD 182694 | G7 IIIa | 2001 Aug 31 | SXD | 2000 | 90 | HD 192538 | Clear |
| 2001 Aug 31 | LXD1.9 | 2500 | 200 | HD 192538 | Clear | ||
| HD 20618 | G7 IV | 2003 Oct 15 | SXD | 2000 | 140 | HD 20995 | Thin Cirrus |
| 2003 Oct 15 | LXD2.1 | 2500 | 200 | HD 20995 | Thin Cirrus | ||
| HD 114946 | G7 IV | 2007 Jun 24 | SXD | 2000 | 90 | HD 112304 | Clear |
| 2007 Jun 24 | LXD2.1 | 2500 | 240 | HD 112304 | Clear | ||
| HD 16139 | G7.5 IIIa | 2000 Oct 24 | SXD | 2000 | 200 | HD 13869 | Clear |
| 2000 Oct 25 | LXD2.3 | 2500 | 300 | HD 13869 | Clear | ||
| HD 208606 | G8 Ib | 2001 Sep 1 | SXD | 2000 | 100 | HD 223386 | Thin Cirrus |
| 2001 Aug 31 | LXD1.9 | 2500 | 200 | HD 223386 | Thin Cirrus | ||
| HD 122563 | G8: III: Fe−5 | 2002 May 31 | SXD | 2000 | 200 | HD 131951 | Clear |
| 2003 May 8 | LXD2.1 | 2500 | 300 | HD 126129 | Clear | ||
| HD 104979 | G8 III Ba1 CN0.5 CH1 | 2002 May 31 | SXD | 2000 | 100 | HD 111744 | Clear |
| 2003 May 7 | LXD1.9 | 2500 | 200 | HD 110411 | Thin Cirrus | ||
| HD 135722 | G8 III Fe−1 | 2004 Jul 6 | SXD | 2000 | 153 | HD 127304 | Clear |
| 2004 Jul 6 | LXD2.1 | 2500 | 100 | HD 127304 | Clear | ||
| HD 101501 | G8 V | 2003 Feb 25 | SXD | 2000 | 120 | HD 105388 | Clear |
| 2003 Jan 16 | LXD2.1 | 2500 | 210 | HD 107655 | Clear | ||
| HD 75732 | G8 V | 2001 Mar 11 | SXD | 2000 | 60 | HD 71906 | Clear |
| 2001 Mar 11 | LXD2.3 | 2500 | 250 | HD 71906 | Clear | ||
| HD 170820 | G9 II CN1 Hδ1 | 2005 Oct 7 | SXD | 2000 | 120 | HD 163336 | Clear |
| 2005 Oct 7 | LXD2.1 | 2500 | 300 | HD 163336 | Clear | ||
| HD 222093 | G9 III | 2001 Aug 29 | SXD | 2000 | 360 | HD 218639 | Clear |
| 2001 Sep 1 | LXD1.9 | 2500 | 100 | HD 218639 | Thin Cirrus | ||
| HD 165782 | K0 Ia | 2005 Jun 22 | SXD | 2000 | 250 | HD 163336 | Thin Cirrus |
| HD 44391 | K0 Ib | 2003 Jan 14 | SXD | 2000 | 120 | HD 46553 | Clear |
| 2003 Nov 20 | LXD1.9 | 2500 | 300 | HD 46553 | Clear | ||
| HD 179870 | K0 II | 2003 Oct 7 | LXD2.1 | 2500 | 250 | HD 182919 | Clear |
| 2005 Jun 22 | SXD | 2000 | 140 | HD 177724 | Thin Cirrus | ||
| HD 100006 | K0 III | 2003 Feb 25 | SXD | 2000 | 105 | HD 101060 | Clear |
| 2003 May 7 | LXD1.9 | 2500 | 300 | HD 107655 | Thin Cirrus | ||
| HD 145675 | K0 V | 2003 Jul 6 | SXD | 2000 | 140 | HD 157778 | Thin Cirrus |
| 2003 Jul 6 | LXD2.1 | 2500 | 300 | HD 157778 | Thin Cirrus | ||
| HD 164349 | K0.5 IIb | 2003 Aug 5 | SXD | 2000 | 60 | HD 165029 | Thin Cirrus |
| HD 9852 | K0.5 III CN1 | 2003 Aug 10 | SXD | 2000 | 120 | HD 12365 | Clear |
| 2003 Sep 21 | LXD2.1 | 2500 | 300 | HD 11946 | Clear | ||
| HD 63302 | K1 Ia−Iab | 2005 Oct 6 | SXD | 2000 | 120 | HD 67725 | Clear |
| 2005 Oct 7 | LXD2.1 | 2500 | 125 | HD 67725 | Clear | ||
| HD 36134 | K1− III Fe−0.5 | 2003 Jan 14 | SXD | 2000 | 120 | HD 34317 | Clear |
| 2003 Nov 20 | LXD1.9 | 2500 | 200 | HD 34317 | Clear | ||
| HD 91810 | K1− IIIb CN1.5 Ca1 | 2003 Feb 25 | SXD | 2000 | 120 | HD 92728 | Clear |
| 2003 May 7 | LXD1.9 | 2500 | 300 | HD 92728 | Thin Cirrus | ||
| HD 25975 | K1 III | 2003 Jan 14 | SXD | 2000 | 144 | HD 25152 | Clear |
| 2003 Nov 20 | LXD1.9 | 2500 | 300 | HD 25152 | Clear | ||
| HD 165438 | K1 IV | 2002 May 29 | SXD | 2000 | 150 | HD 171149 | Clear |
| HD 142091 | K1 IVa | 2003 Feb 24 | SXD | 2000 | 180 | HD 140729 | Clear |
| HD 10476 | K1 V | 2002 Nov 11 | SXD | 2000 | 120 | HD 13869 | Thin Cirrus |
| 2003 Sep 21 | LXD2.1 | 2500 | 300 | HD 6457 | Clear | ||
| HD 124897 | K1.5 III Fe−0.5 | 2003 May 28 | SXD | 2000 | 120 | HD 121996 | Clear |
| 2003 May 28 | LXD2.1 | 2500 | 150 | HD 121996 | Clear | ||
| HD 212466 | K2 O−Ia | 2005 Aug 26 | SXD | 2000 | 100 | HD 205314 | Clear |
| 2005 Aug 26 | LXD2.1 | 2500 | 200 | HD 205314 | Clear | ||
| HD 2901 | K2 III Fe−1 | 2003 Aug 10 | SXD | 2000 | 90 | HD 1561 | Clear |
| 2003 Aug 10 | LXD2.1 | 2500 | 300 | HD 1561 | Clear | ||
| HD 132935 | K2 III | 2002 May 31 | LXD2.1 | 2500 | 500 | HD 141513 | Clear |
| 2004 Jul 5 | SXD | 2000 | 200 | HD 133772 | Clear | ||
| HD 137759 | K2 III | 2003 Feb 23 | SXD | 2000 | 72 | HD 143187 | Clear |
| HD 3765 | K2 V | 2000 Oct 20 | SXD | 2000 | 300 | HD 1561 | Thin Cirrus |
| 2003 Oct 7 | LXD2.1 | 2500 | 250 | HD 6457 | Clear | ||
| HD 23082 | K2.5 II | 2003 Oct 3 | SXD | 2000 | 150 | HD 21038 | Clear |
| 2003 Oct 3 | LXD2.1 | 2500 | 180 | HD 21038 | Clear | ||
| HD 187238 | K3 Iab−Ib | 2003 Aug 10 | SXD | 2000 | 50 | HD 182919 | Clear |
| 2005 Aug 26 | LXD2.1 | 2500 | 200 | HD 182919 | Clear | ||
| HD 16068 | K3 II−III | 2003 Aug 10 | SXD | 2000 | 75 | HD 23452 | Clear |
| 2005 Oct 7 | LXD2.1 | 2500 | 300 | HD 23594 | Clear | ||
| HD 221246 | K3 III | 2002 Nov 11 | SXD | 2000 | 200 | HD 219290 | Thin Cirrus |
| 2008 Oct 8 | LXD2.1 | 2500 | 150 | HD 219290 | Thin Cirrus | ||
| HD 178208 | K3 III | 2005 Jun 22 | SXD | 2000 | 200 | HD 178207 | Thin Cirrus |
| HD 35620 | K3 III Fe1 | 2003 Jan 16 | SXD | 2000 | 120 | HD 31069 | Clear |
| 2003 Nov 20 | LXD1.9 | 2500 | 150 | HD 31592 | Clear | ||
| HD 99998 | K3+ III Fe−0.5 | 2003 May 29 | SXD | 2000 | 120 | HD 97585 | Thin Cirrus |
| 2003 May 29 | LXD1.9 | 2500 | 200 | HD 97585 | Thin Cirrus | ||
| HD 114960 | K3.5 IIIb CN0.5 CH0.5 | 2003 Feb 25 | SXD | 2000 | 150 | HD 116960 | Clear |
| 2003 May 7 | LXD1.9 | 2500 | 300 | HD 110411 | Thin Cirrus | ||
| HD 219134 | K3 V | 2001 Aug 6 | SXD | 2000 | 45 | HD 223386 | Clear |
| 2001 Aug 6 | LXD2.1 | 2500 | 200 | HD 223386 | Clear | ||
| HD 185622 | K4 Ib | 2003 Aug 10 | SXD | 2000 | 50 | HD 182919 | Clear |
| HD 201065 | K4 Ib−II | 2001 Oct 11 | SXD | 2000 | 150 | HD 205314 | Clear |
| 2001 Oct 11 | LXD1.9 | 2500 | 300 | HD 205314 | Clear | ||
| HD 207991 | K4− III | 2002 Jul 13 | SXD | 2000 | 150 | HD 205314 | Clear |
| 2003 Oct 7 | LXD2.1 | 2500 | 200 | HD 205314 | Clear | ||
| HD 45977 | K4 V | 2003 Oct 16 | SXD | 2000 | 300 | HD 48481 | Thin Cirrus |
| HD 216946 | K5 Ib | 2003 Oct 16 | SXD | 2000 | 110 | HD 219290 | Thin Cirrus |
| 2003 Oct 16 | LXD2.1 | 2500 | 125 | HD 219290 | Thin Cirrus | ||
| HD 181596 | K5 III | 2005 Jun 24 | SXD | 2000 | 250 | HD 178207 | Thin Cirrus |
| 2008 Oct 12 | LXD2.1 | 2500 | 300 | HD 178207 | Thin Cirrus | ||
| HD 36003 | K5 V | 2000 Dec 11 | SXD | 2000 | 300 | HD 36058 | Clear |
| 2000 Dec 11 | LXD2.3 | 1500 | 250 | HD 36058 | Clear | ||
| HD 120477 | K5.5 III | 2003 May 29 | SXD | 2000 | 78 | HD 121996 | Thin Cirrus |
| 2003 May 29 | LXD1.9 | 2500 | 15 | HD 121996 | Thin Cirrus | ||
| HD 3346 | K6 IIIa | 2003 Oct 16 | SXD | 2000 | 100 | HD 1561 | Thin Cirrus |
| HD 181475 | K7 IIa | 2003 Oct 16 | SXD | 2000 | 200 | HD 171149 | Thin Cirrus |
| HD 194193 | K7 III | 2003 Oct 16 | SXD | 2000 | 150 | HD 199312 | Thin Cirrus |
| 2005 Aug 26 | LXD2.1 | 2500 | 300 | HD 192538 | Clear | ||
| HD 237903 | K7 V | 2002 Jan 10 | SXD | 2000 | 300 | HD 92728 | Clear |
| 2002 Jan 11 | LXD2.1 | 1500 | 500 | HD 92728 | Thin Cirrus | ||
| HD 201092 | K7 V | 2001 Oct 20 | SXD | 2000 | 125 | HD 192538 | Thin Cirrus |
| HD 213893 | M0 IIIb | 2005 Oct 7 | SXD | 2000 | 150 | HD 212061 | Clear |
| 2005 Oct 7 | LXD2.1 | 2500 | 300 | HD 212061 | Clear | ||
| HD 19305 | M0 V | 2001 Oct 12 | SXD | 2000 | 600 | HD 21379 | Clear |
| 2000 Oct 25 | LXD2.3 | 2500 | 300 | HD 23258 | Clear | ||
| HD 236697 | M0.5 Ib | 2001 Oct 11 | SXD | 2000 | 180 | HD 1561 | Clear |
| 2001 Oct 19 | LXD1.9 | 2500 | 300 | HD 1561 | Clear | ||
| HD 209290 | M0.5 V | 2000 Oct 24 | SXD | 2000 | 200 | GJ 9779 | Thin Cirrus |
| 2000 Oct 25 | LXD2.3 | 2500 | 300 | GJ 9779 | Clear | ||
| HD 339034 | M1 Ia | 2003 Jul 6 | SXD | 2000 | 150 | HD 182919 | Thin Cirrus |
| 2003 Jul 6 | LXD2.1 | 2500 | 200 | HD 182919 | Thin Cirrus | ||
| HD 14404 | M1− Iab−Ib | 2003 Jan 16 | SXD | 2000 | 120 | HD 15090 | Clear |
| 2003 Nov 20 | LXD1.9 | 2500 | 250 | HD 19844 | Thin Cirrus | ||
| HD 39801 | M1−M2 Ia−Iab | 2003 Nov 6 | SXD | 2000 | 200 | HD 41076 | Clear |
| 2003 Nov 6 | LXD2.1 | 2500 | 200 | HD 41076 | Clear | ||
| HD 204724 | M1+ III | 2005 Oct 6 | SXD | 2000 | 153 | HD 208108 | Clear |
| 2005 Oct 6 | LXD2.1 | 2500 | 184 | HD 208108 | Clear | ||
| HD 42581 | M1 V | 2002 Jan 10 | SXD | 2000 | 200 | HD 42301 | Clear |
| 2002 Jan 11 | LXD2.1 | 2500 | 250 | HD 42301 | Thin Cirrus | ||
| HD 35601 | M1.5 Iab−Ib | 2001 Oct 12 | SXD | 2000 | 180 | HD 31069 | Clear |
| 2003 Nov 20 | LXD1.9 | 2500 | 150 | HD 31592 | Clear | ||
| BD +60 265 | M1.5 Ib | 2005 Aug 26 | SXD | 2000 | 300 | HD 11946 | Clear |
| 2005 Aug 26 | LXD2.1 | 2500 | 200 | HD 11946 | Clear | ||
| HD 36395 | M1.5 V | 2000 Oct 24 | SXD | 2000 | 100 | HD 40210 | Clear |
| 2000 Oct 25 | LXD2.3 | 2500 | 300 | HD 34317 | Clear | ||
| HD 206936 | M2− Ia | 2005 Aug 26 | SXD | 2000 | 100 | HD 219290 | Clear |
| 2005 Aug 26 | LXD2.3 | 2500 | 100 | HD 194354 | Clear | ||
| HD 10465 | M2 Ib | 2003 Jan 16 | SXD | 2000 | 180 | HD 1561 | Clear |
| 2003 Oct 7 | LXD2.1 | 2500 | 200 | HD 21038 | Clear | ||
| HD 23475 | M2 II | 2003 Jan 16 | SXD | 2000 | 60 | HD 14632 | Clear |
| HD 120052 | M2 III | 2002 May 28 | SXD | 2000 | 90 | HD 124683 | Clear |
| 2002 May 28 | LXD2.1 | 2500 | 150 | HD 124683 | Clear | ||
| HD 95735 | M2 V | 2000 Dec 10 | SXD | 2000 | 60 | HD 88960 | Clear |
| 2000 Dec 10 | LXD2.3 | 1500 | 500 | HD 88960 | Clear | ||
| Gl 806 | M2 V | 2003 Jul 7 | SXD | 2000 | 300 | HD 199312 | Thin Cirrus |
| HD 219734 | M2.5 III Ba0.5 | 2002 Nov 11 | SXD | 2000 | 150 | HD 219290 | Thin Cirrus |
| 2003 Oct 7 | LXD2.1 | 2500 | 100 | HD 219290 | Clear | ||
| Gl 381 | M2.5 V | 2002 Jan 10 | SXD | 2000 | 300 | HD 85504 | Clear |
| 2002 Jan 11 | LXD2.1 | 1500 | 500 | HD 85504 | Thin Cirrus | ||
| Gl 581 | M2.5 V | 2000 Jun 24 | SXD | 2000 | 200 | HD 141513 | Clear |
| 2000 Jun 24 | LXD2.1 | 2500 | 150 | HD 141513 | Clear | ||
| RW Cyg | M3 to M4 Ia−Iab | 2003 Jul 7 | SXD | 2000 | 82 | HD 199312 | Thin Cirrus |
| 2003 Jul 7 | LXD1.9 | 2500 | 70 | HD 199312 | Thin Cirrus | ||
| CD −31 4916 | M3 Iab−Ia | 2002 Jan 11 | SXD | 2000 | 250 | HD 68027 | Thin Cirrus |
| 2003 Nov 20 | LXD1.9 | 2500 | 200 | HD 70963 | Clear | ||
| HD 14469 | M3−M4 Iab | 2003 Jan 16 | SXD | 2000 | 120 | HD 15090 | Clear |
| 2003 Oct 6 | LXD2.1 | 2500 | 100 | HD 23594 | Thin Cirrus | ||
| HD 40239 | M3 IIb | 2002 Jan 10 | SXD | 2000 | 50 | HD 45105 | Clear |
| 2001 Jan 11 | LXD2.1 | 2500 | 100 | HD 45105 | Thin Cirrus | ||
| HD 39045 | M3 III | 2002 Jan 10 | SXD | 2000 | 150 | HD 46533 | Clear |
| 2002 Jan 11 | LXD2.1 | 2500 | 125 | HD 46533 | Thin Cirrus | ||
| Gl 388 | M3 V | 2000 Dec 10 | SXD | 2000 | 180 | HD 88960 | Clear |
| 2000 Dec 10 | LXD2.3 | 1500 | 250 | HD 88960 | Clear | ||
| HD 14488 | M3.5 Iab Fe−1 var? | 2005 Aug 26 | SXD | 2000 | 150 | HD 23452 | Clear |
| 2005 Aug 26 | LXD2.1 | 2500 | 150 | HD 23594 | Clear | ||
| HD 28487 | M3.5 III Ca−0.5 | 2003 Jan 16 | SXD | 2000 | 126 | HD 31411 | Clear |
| 2003 Oct 8 | LXD2.1 | 2500 | 125 | HD 31295 | Clear | ||
| Gl 273 | M3.5 V | 2002 Jan 11 | SXD | 2000 | 300 | HD 50931 | Thin Cirrus |
| 2002 Feb 28 | LXD2.1 | 2500 | 600 | HD 50931 | Clear | ||
| HD 19058 | M4+ IIIa | 2003 Jan 16 | SXD | 2000 | 108 | HD 20995 | Clear |
| 2003 Nov 20 | LXD1.9 | 2500 | 100 | HD 21038 | Clear | ||
| HD 214665 | M4+ III | 2001 Oct 21 | SXD | 2000 | 100 | HD 223386 | Thin Cirrus |
| 2001 Oct 21 | LXD1.9 | 2500 | 100 | HD 223386 | Thin Cirrus | ||
| HD 4408 | M4 III | 2003 Jan 3 | SXD | 2000 | 50 | HD 6457 | Clear |
| 2003 Oct 7 | LXD2.1 | 2500 | 102 | HD 6457 | Clear | ||
| HD 27598 | M4− III | 2003 Jan 16 | SXD | 2000 | 180 | HD 29575 | Clear |
| 2003 Oct 8 | LXD2.1 | 2500 | 300 | HD 29573 | Clear | ||
| Gl 213 | M4 V | 2000 Dec 9 | SXD | 2000 | 720 | HD 34203 | Clear |
| 2000 Dec 9 | LXD2.3 | 1500 | 500 | HD 41076 | Clear | ||
| Gl 299 | M4 V | 2000 Dec 11 | SXD | 2000 | 1200 | HD 75137 | Clear |
| 2000 Dec 11 | LXD2.3 | 1500 | 5000 | HD 75137 | Clear | ||
| HD 204585 | M4.5 IIIa | 2002 Jul 14 | SXD | 2000 | 110 | HD 208108 | Clear |
| Gl 268AB | M4.5 V | 2000 Dec 10 | SXD | 2000 | 600 | HD 56386 | Clear |
| 2000 Dec 10 | LXD2.3 | 1500 | 500 | HD 56386 | Clear | ||
| HD 156014 | M5 Ib−II | 2005 Aug 26 | SXD | 2000 | 100 | HD 165029 | Clear |
| 2005 Aug 26 | LXD1.9 | 2500 | 100 | HD 165029 | Clear | ||
| HD 175865 | M5 III | 2003 May 7 | SXD | 2000 | 60 | HD 174567 | Thin Cirrus |
| Gl 51 | M5 V | 2000 Nov 6 | SXD | 2000 | 600 | HD 11946 | Clear |
| 2000 Nov 6 | LXD2.3 | 1500 | 250 | HD 11946 | Clear | ||
| Gl 866ABC | M5 V | 2001 Oct 11 | SXD | 2000 | 600 | HD 218639 | Clear |
| 2001 Oct 19 | LXD1.9 | 2500 | 300 | HD 218639 | Clear | ||
| HD 94705 | M5.5 III: | 2003 May 8 | SXD | 2000 | 60 | HD 97595 | Clear |
| 2003 May 8 | LXD2.1 | 2500 | 60 | HD 97595 | Thin Cirrus | ||
| HD 196610 | M6 III | 2002 Jul 14 | SXD | 2000 | 100 | HD 196724 | Clear |
| 2003 Oct 7 | LXD2.1 | 2500 | 100 | HD 196724 | Clear | ||
| HD 18191 | M6− III: | 2003 Jan 16 | SXD | 2000 | 120 | HD 16811 | Clear |
| 2003 Sep 20 | LXD2.1 | 2500 | 31 | HD 16811 | Clear | ||
| Gl 406 | M6 V | 2001 Jan 25 | SXD | 2000 | 360 | HD 97585 | Clear |
| 2001 Jan 24 | LXD2.3 | 2500 | 500 | HD 97585 | Clear | ||
| GJ 1111 | M6.5 V | 2000 Dec 9 | SXD | 2000 | 960 | HD 64648 | Clear |
| 2000 Dec 9 | LXD2.3 | 2000 | 1000 | HD 64648 | Clear | ||
| HD 14386 | M5e−M9e III | 2003 Nov 6 | SXD | 2000 | 100 | HD 15130 | Clear |
| 2003 Sep 20 | LXD2.1 | 2500 | 153 | HD 13936 | Clear | ||
| HD 108849 | M7− III: | 2003 May 8 | SXD | 2000 | 100 | HD 110411 | Clear |
| 2003 May 8 | LXD2.1 | 2500 | 54 | HD 110411 | Clear | ||
| HD 207076 | M7− III: | 2003 Oct 16 | SXD | 2000 | 100 | HD 212061 | Thin Cirrus |
| 2003 Oct 16 | LXD2.1 | 2500 | 100 | HD 212061 | Thin Cirrus | ||
| Gl 644C | M7 V | 2001 Jul 12 | SXD | 2000 | 1440 | HD 148968 | Thin Cirrus |
| 2001 Jul 12 | LXD1.9 | 940 | 660 | HD 148968 | Thin Cirrus | ||
| MY Cep | M7−M7.5 I | 2003 Aug 10 | SXD | 2000 | 450 | HD 223386 | Clear |
| 2003 Aug 10 | LXD2.1 | 2500 | 200 | HD 223386 | Clear | ||
| HD 69243 | M6e−M9e III | 2007 Jan 18 | SXD | 2000 | 100 | HD 64648 | Clear |
| 2007 Jan 18 | LXD2.1 | 2500 | 100 | HD 64648 | Clear | ||
| BRI B2339 − 0447 | M7 − 8 III | 2006 Nov 29 | SXD | 2000 | 1200 | HD 215143 | Thin Cirrus |
| 2006 Nov 29 | LXD1.9 | 2500 | 300 | HD 215143 | Thick Cirrus | ||
| IRAS 01037+1219 | M8 III | 2007 Jan 18 | SXD | 2000 | 450 | HD 6457 | Clear |
| 2007 Jan 18 | LXD2.1 | 2500 | 100 | HD 6457 | Clear | ||
| Gl 752B | M8 V | 2001 Jul 13 | SXD | 2000 | 600 | HD 183324 | Clear |
| 2001 Jul 13 | LXD1.9 | 940 | 600 | HD 183324 | Clear | ||
| LP 412 − 31 | M8 V | 2003 Sep 20 | SXD | 2000 | 1800 | HD 21686 | Clear |
| 2003 Sep 21 | LXD1.9 | 1500 | 600 | HD 21686 | Clear | ||
| IRAS 21284 − 0747 | M8 − 9 III | 2006 Nov 29 | SXD | 2000 | 300 | HD 198070 | Thin Cirrus |
| 2006 Nov 29 | LXD2.1 | 2500 | 300 | HD 212061 | Clear | ||
| IRAS 14436 − 0703 | M8 − 9 III | 2006 Jun 24 | SXD | 2000 | 200 | HD 132072 | Thin Cirrus |
| IRAS 14303 − 1042 | M8 − 9 III | 2006 Jun 24 | SXD | 2000 | 600 | HD 132072 | Thin Cirrus |
| IRAS 15060+0947 | M9 III | 2006 Jun 24 | SXD | 2000 | 150 | HD 131951 | Thin Cirrus |
| BRI B1219 − 1336 | M9 III | 2006 Jun 24 | SXD | 2000 | 300 | HD 110902 | Thin Cirrus |
| DENIS−P J104814.7 − 395606.1 | M9 V | 2000 Dec 9 | SXD | 2000 | 1440 | HD 99627 | Clear |
| 2000 Dec 11 | LXD1.9 | 940 | 1260 | HD 99627 | Clear | ||
| LP 944 − 20 | M9 V | 2001 Jan 24 | SXD | 2000 | 2400 | HD 18735 | Clear |
| 2002 Jan 11 | LXD2.1 | 940 | 3600 | HD 18735 | Thin Cirrus | ||
| LHS 2065 | M9 V | 2000 Dec 10 | SXD | 1200 | 1920 | HD 71155 | Clear |
| LHS 2924 | M9 V | 2003 Feb 23 | SXD | 2000 | 1200 | HD 127304 | Clear |
| BRI B0021 − 0214 | M9.5 V | 2001 Oct 12 | SXD | 2000 | 1440 | HD 9485 | Thin Cirrus |
| 2000 Nov 6 | LXD1.9 | 940 | 600 | HD 1663 | Thin Cirrus | ||
| IRAS 14086 − 0703 | M10+ III | 2006 Jun 24 | SXD | 2000 | 300 | HD 132072 | Thin Cirrus |
| HD 142143 | M6.5S to M7S III: | 2006 Jul 10 | SXD | 2000 | 75 | HD 121409 | Clear |
| 2006 Jul 10 | LXD2.1 | 2500 | 125 | HD 121409 | Clear | ||
| BD +44 2267 | S2.5 Zr 2 | 2008 Apr 2 | SXD | 2000 | 90 | HD 99966 | Clear |
| 2008 Apr 2 | LXD1.9 | 2500 | 90 | HD 99966 | Clear | ||
| HD 64332 | S4.5 Zr 2 Ti 4 | 2007 Mar 16 | SXD | 2000 | 150 | HD 67725 | Clear |
| 2007 Mar 16 | LXD2.1 | 2500 | 300 | HD 67725 | Clear | ||
| HD 44544 | SC5.5 Zr 0.5 | 2008 Apr 2 | SXD | 2000 | 90 | HD 45137 | Clear |
| 2008 Apr 2 | LXD1.9 | 2500 | 90 | HD 45137 | Clear | ||
| HD 62164 | S5−S6 Zr 3 to 4 Ti 0 | 2007 Mar 15 | SXD | 2000 | 135 | HD 67725 | Clear |
| 2007 Mar 15 | LXD2.1 | 2500 | 150 | HD 67725 | Clear | ||
| HD 76846 | C−R2+ IIIa: C2 2.5 | 2007 Mar 15 | SXD | 2000 | 360 | HD 71906 | Clear |
| 2007 Mar 16 | LXD1.9 | 2500 | 300 | HD 71906 | Clear | ||
| HD 31996 | C7, 6e(N4) | 2007 Jan 18 | SXD | 2000 | 140 | HD 29573 | Clear |
| 2007 Jan 18 | LXD2.1 | 2500 | 150 | HD 29573 | Clear | ||
| HD 44984 | C−N4 C2 3.5 | 2007 Mar 15 | SXD | 2000 | 306 | HD 42477 | Clear |
| 2007 Mar 15 | LXD2.1 | 2500 | 255 | HD 42477 | Clear | ||
| HD 76221 | C−N 4.5 C2 5.5 MS 3 | 2007 Mar 15 | SXD | 2000 | 92 | HD 64648 | Clear |
| 2007 Mar 16 | LXD2.1 | 2500 | 102 | HD 64648 | Clear | ||
| HD 92055 | C−N4.5 C2 4.5 | 2007 Apr 25 | SXD | 2000 | 180 | HD 92245 | Clear |
| 2007 Apr 25 | LXD1.9 | 2500 | 255 | HD 92245 | Clear | ||
| HD 70138 | C−J4.5 IIIa: C2 6 j 6 | 2007 Mar 17 | SXD | 2000 | 180 | HD 69589 | Clear |
| 2007 Mar 17 | LXD2.1 | 2500 | 300 | HD 69589 | Clear | ||
| HD 48664 | C−N5 C2 6 | 2007 Mar 16 | SXD | 2000 | 180 | HD 45137 | Clear |
| 2007 Mar 16 | LXD2.1 | 2500 | 300 | HD 45137 | Clear | ||
| HD 57160 | C−J5− C2 5− j 4 | 2007 Mar 17 | SXD | 2000 | 150 | HD 64648 | Clear |
| 2007 Mar 17 | LXD2.1 | 2500 | 300 | HD 64648 | Clear |
To facilitate subtraction of the additive components of the total signal (electronic bias level, dark current, sky and background emission) during the reduction process, the observations were obtained in a series of exposures in which the target was nodded along the slit between two positions separated by 75, and a sequence of nodded pairs was taken to build up S/N. A minimum of three pairs were taken (six spectra) to allow noisy pixels (mainly due to cosmic ray hits) to be rejected by a sigma-clipping algorithm. Guiding was done on spill-over from the science target in the slit using the infrared slit-viewing camera. In the SXD mode, where atmospheric dispersion is significant compared to the slit width of 03 (see Figure 2), the image rotator was set to the parallactic angle prior to each observation. As discussed in Section 2.3, observing at the parallactic angle minimized spectral slope variations. This is not as important in the LXD mode where atmospheric dispersion is an order a magnitude smaller.
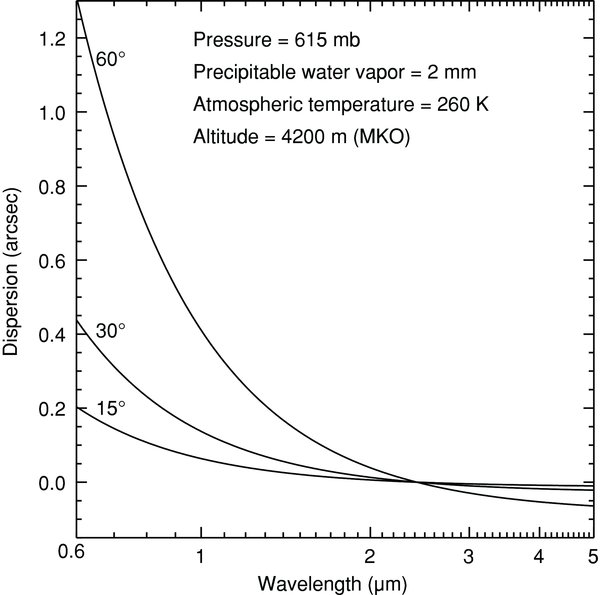
Figure 2. Atmospheric dispersion for the summit of Mauna Kea and the conditions indicated, as a function of wavelength (relative to 2.4 μm) and zenith angle. Since the magnitude of atmospheric dispersion in the NIR is significant compared to the slit width used (03), observations were made at the parallactic angle to minimize slit losses and measure the spectral shape more accurately.
Download figure:
Standard image High-resolution imageAn A0 V star was observed before or after each science object to correct for absorption due to the Earth's atmosphere (see Figure 3) and to flux calibrate the science object spectra. The airmass difference between the object and "telluric standard" was almost always less than 0.1 and usually less than 0.05. However, in a few cases where there was a paucity of nearby A0 V stars, the airmass difference was as large as 0.15. Standard stars were also chosen to be located within 10 deg of the science object whenever possible, to minimize the effects of any differential flexure in the instrument between the observations of the object and standard. This limit on the angular distance provides a good compromise between the requirements to match airmass, minimize flexure, and find suitably bright standard stars. On those few occasions when it was necessary to observe a telluric standard more than 10 deg away from the object due to a lack of A0 V stars in certain parts of the sky, we found that telluric CO2 (predominantly at 2.01 μm) features were sometimes not adequately removed by the standard star despite a good airmass match and good correction of telluric H2O. (See, for example, Figure 54, where the F7 III and F8 III stars were corrected with telluric standard stars at separations and airmass differences of 14 deg and 0.09, and 21 deg and 0.05, respectively.) We attribute this to the possibility that telluric H2O and CO2 are not well mixed and to patchy CO2 distribution. Finally, a set of internal flat field exposures and argon arc lamp exposures was taken after each object/standard pair for flat fielding and wavelength calibration purposes.
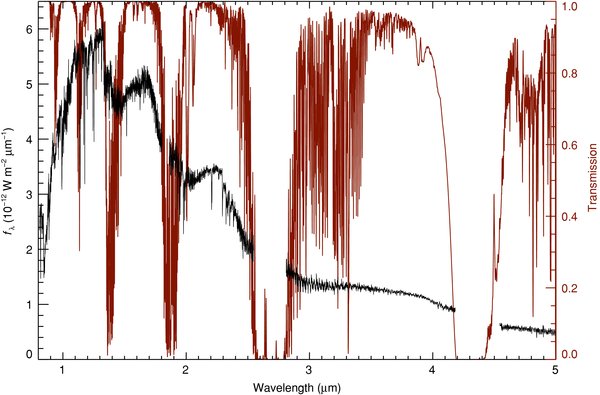
Figure 3. Atmospheric transmission for Mauna Kea (4200 m, airmass 1.15, precipitable water vapor 2 mm) overplotted with the spectrum of Gl 406 (M6 V).
Download figure:
Standard image High-resolution image2.3. Data Reduction
We reduced the data using Spextool (Cushing et al. 2004), the facility IDL-based data reduction package for SpeX. The initial image processing consisted of correcting each science frame for nonlinearity, subtracting the pairs of images taken at the two different slit positions, and dividing the pair-subtracted images by a normalized flat field. In each frame, the spectra in the individual orders were then optimally extracted (e.g., Horne 1986) and wavelength calibrated. (All wavelengths are given in vacuum.) The extracted spectra in each order from the set of frames for a given object were then combined using the median. This resulted in a single spectrum in each order for a given object.
The spectra in the individual orders were then corrected for telluric absorption and flux calibrated using the extracted A0 V spectra and the technique described by Vacca et al. (2003). In addition to correcting for the absorption due to the atmosphere, this process also removes the signature of the instrumental throughput and restores the intrinsic (i.e., above the atmosphere) spectrum of each science object in each spectral order. Briefly, this technique scales a theoretical model spectrum of Vega to the observed visual magnitude of the observed standard star, convolves it to the observed resolution, and adjusts the H i line strengths to match the observed strengths of the standard star. The ratio of the adjusted model spectrum to the observed spectrum of the A0V star gives the telluric correction spectrum (which also includes correction for the instrument throughput) in each order. The science object spectrum is then divided by the telluric spectrum. The resulting flux calibration is accurate to about 10%. The sharp and deep telluric absorption features are marginally sampled with a 2 pixel-wide slit so that when the object and telluric correction spectra are ratioed, residuals remain at the wavelengths of these features due to a small amount of instrumental flexure between the object and standard star positions. In order to minimize these systematic errors, the telluric correction spectrum is first shifted relative to the object spectrum until the noise in these regions is minimized. Typically, these shifts are ∼0.1–0.2 pixel for telescope movements of 10 deg.
In principle, the flux density levels of the telluric-corrected spectra in two adjacent orders should match exactly in the wavelength region where they overlap; in practice we find offsets of usually less than 1%, although occasionally as large as 3%. The level mismatch was removed by scaling one spectrum to the level of the other. The scale factor was determined from a section of the overlap region where both spectra were judged to have sufficient S/N to allow an accurate determination. The telluric-corrected and scaled spectra in the individual orders were then merged together to form a single, continuous spectrum for the science object. Regions of strong telluric absorption were then removed. The precise wavelength intervals removed depended on the transparency of the atmosphere at the time of observation but always included the ∼2.5–2.8 μm and ∼4.2–4.6 μm regions. For each object, the SXD and LXD spectra were combined in a manner similar to that used to combine the individual orders. A scale factor was determined from the overlapping wavelength region and then used to adjust the SXD and LXD spectra to a common level.
The next step in the reduction process was to absolutely flux calibrate the spectra using the 2MASS photometry listed in Table 2. For each spectrum, we computed correction factors based on the JHKS photometry given by
where FVegaX is the Vega flux, mX is the magnitude of the object, ZPX is the passband zero point, SX(λ) is the system response function in bandpass X, and fobsλ is the flux density of the object. We used the Vega fluxes (5.082 × 10⁻¹⁰, 2.843 × 10⁻¹⁰, 1.122 × 10⁻¹⁰ W m−2), zero points (+0.001, −0.019, +0.017), and the system response functions given by Cohen et al. (2003). Each spectrum was then multiplied by a single scale factor 〈C〉 given by the weighted average of the J-, H-, and KS-band correction factors (fλ = fobsλ× 〈C〉). The weights were given by the errors in the scale factors, which in turn were derived from the photometric uncertainties. This scaling has the effect of shifting the entire spectrum up or down so that the overall absolute flux level is correct, while simultaneously preserving the relative flux calibration of each spectral order derived from the observations and telluric correction procedures. For variable stars in the sample (mostly TPAGB stars), the absolute flux calibration is only approximate since the 2MASS photometry was obtained at an earlier epoch than the SpeX spectroscopy. Furthermore, not all the SXD and LXD spectra of individual stars were obtained at the same epoch.
The spectrum of each object is then shifted to zero radial velocity. To do this, we first selected two stars, HD 219623 (F8 V) and HD 201092 (K7 V), as representatives of F–G, and K–M stars, respectively, and measured their apparent radial velocities using the observed wavelengths of strong, isolated atomic lines. For HD 219623 we measured the positions of the Pa (0.9548590 μm), Pa γ (1.0052128 μm), Pa β (1.282159 μm), Mg i (1.4881683 μm), Mg i (1.7113304 μm), and Br γ (2.166120 μm) lines and for HD 201092 we used the Si i (1.0588042 μm), Mg i (1.1831408 μm), Mg i (1.4881683 μm), and Mg i (1.7113304 μm) lines. The observed radial velocities for these two stars were determined by averaging the radial velocity measurements obtained from these lines. The standard error on the mean radial velocity was ∼3 km s−1 for both stars. We then shifted the spectra of these two stars in wavelength to correspond to zero radial velocity. To determine the radial velocities of the remaining stars in the library, we cross-correlated the 1.05–1.10 μm spectra of the F–G stars (which contain isolated lines of Si, C, Mg, and Fe) against that of HD 219623 and the 2.285–2.33 μm spectra of the K and M stars (which contain the Δν = +2 CO overtone bands) against that of HD 201092. The peak of each cross-correlation function was fitted with a second-order polynomial to determine the radial velocity. Based on our implementation of the cross-correlation technique described by Tonry & Davis (1979) as well as a comparison of the radial velocities derived from different wavelength regions in each spectrum, we estimate the uncertainty in our radial velocity values to be generally less than 30 km s−1. The spectrum of each object was then shifted to zero radial velocity using the radial velocity derived from the cross-correlation. It should be noted that, in order to preserve the accuracy of our data, we did not resample or rebin the final spectra to a common wavelength scale after shifting them, and therefore each spectrum has a unique wavelength array. In most cases, the velocity shifts are small: the average shift was found to be 4.5 ± 37 km s−1 with a maximum of about 131 km s−1. Both values are smaller than our velocity resolution (150 km s−1 per resolution element).
Although the stars in our sample are generally bright and nearby, some stars show evidence of interstellar reddening. For those applications requiring true spectral energy distributions (e.g., EPS studies) reddening needs to be corrected. Consequently, as a final step in the data reduction, we corrected the spectra for reddening. We determined the E(B − V) ≡ (B − V) − (B − V)0 color excess from the observed (B − V) color and an intrinsic (B − V)0 color appropriate for its spectral type. The observed colors were taken from the Mermilliod (2006) catalog and are on the Johnson photometric system. For the few stars that were not included in this catalog, we adopted the (B − V) color given by Kharchenko (2001), Leggett (1992), and Beauchamp et al. (1994). We adopted the calibration of intrinsic colors as a function of spectral type by Fitzgerald (1970). For the M dwarfs, we found that the Fitzgerald (1970) values gave unreasonably large color excess values for stars that are very nearby (less than 20 pc). Furthermore, while other calibrations of intrinsic colors (e.g., Schmidt-Kaler 1982) agree well with that of Fitzgerald (1970) at earlier spectral types, they differ markedly for M stars, with the later calibrations becoming progressively redder. For these reasons, we adopted the intrinsic colors given by Leggett (1992) for the M dwarfs, which generally yield very small (or even negative) values for E(B − V) for these stars. To derive intrinsic colors for stars with intermediate spectral types and luminosity classes not tabulated in the combined FitzGerald/Leggett calibration, we performed a two-dimensional surface interpolation over the intrinsic color values as a function of spectral subtype and luminosity class. The distribution of E(B − V) values for the stars in our sample is shown in Figure 1(b). As expected for the bright (and generally nearby) stars in our sample, the distribution is peaked near zero. Fitting a Gaussian to the values of E(B − V) < 0 indicates that the uncertainty on the color excesses is about σ = 0.036 mag. All color excesses determined to be less than zero were set to zero in the dereddening process. Furthermore, based on our findings for the standard deviation of the distribution, we chose not to correct any spectra with E(B − V) < 0.108. The 66 dereddened stars along with their (B − V), (B − V)0, E(B − V), and AV values are given in Table 5.
Table 5. Stars with E(B − V) > 0.108
| Object | Spectral Type | (B − V) (mag) | (B − V)0 (mag) | E(B − V) (mag) | AV (mag) |
|---|---|---|---|---|---|
| (1) | (2) | (3) | (4) | (5) | (6) |
| HD 6130 | F0 II | 0.491 | 0.200 | 0.291 | 0.9 |
| HD 7927 | F0 Ia | 0.680 | 0.150 | 0.530 | 1.6 |
| HD 135153 | F0 Ib−II | 0.376 | 0.180 | 0.196 | 0.6 |
| HD 173638 | F1 II | 0.595 | 0.220 | 0.375 | 1.1 |
| HD 182835 | F2 Ib | 0.593 | 0.180 | 0.413 | 1.2 |
| HD 213306 | F5 Ib − G1 Ib | 0.480 | 0.260 | 0.220 | 0.7 |
| HD 190323 | F8 Ia | 0.874 | 0.550 | 0.324 | 1.0 |
| HD 51956 | F8 Ib | 0.803 | 0.550 | 0.253 | 0.8 |
| HD 6903 | F9 IIIa | 0.689 | 0.580 | 0.109 | 0.3 |
| HD 185018 | G0 Ib−II | 0.881 | 0.770 | 0.111 | 0.3 |
| HD 21018 | G1 III: CH−1: | 0.862 | 0.690 | 0.172 | 0.5 |
| HD 39949 | G2 Ib | 1.090 | 0.880 | 0.210 | 0.6 |
| HD 42454 | G2 Ib | 1.232 | 0.880 | 0.352 | 1.1 |
| HD 192713 | G3 Ib−II Wk H&K comp? | 1.046 | 0.890 | 0.156 | 0.5 |
| HD 176123 | G3 II | 0.990 | 0.870 | 0.120 | 0.4 |
| HD 179821 | G4 O−Ia | 1.555 | 0.960 | 0.595 | 1.8 |
| HD 6474 | G4 Ia | 1.617 | 0.960 | 0.657 | 2.0 |
| HD 190113 | G5 Ib | 1.500 | 1.000 | 0.500 | 1.5 |
| HD 202314 | G6 Ib−IIa Ca1 Ba0.5 | 1.102 | 0.980 | 0.122 | 0.4 |
| HD 161664 | G6 Ib Hδ1 | 1.490 | 1.040 | 0.450 | 1.4 |
| HD 16139 | G7.5 IIIa | 1.052 | 0.940 | 0.112 | 0.3 |
| HD 333385 | G7 Ia | 2.187 | 1.100 | 1.087 | 3.3 |
| HD 25877 | G7 II | 1.161 | 0.950 | 0.211 | 0.6 |
| HD 208606 | G8 Ib | 1.600 | 1.140 | 0.460 | 1.4 |
| HD 75732 | G8 V | 0.860 | 0.740 | 0.120 | 0.4 |
| HD 170820 | G9 II CN1 Hδ1 | 1.575 | 1.020 | 0.555 | 1.7 |
| HD 165782 | K0 Ia | 2.140 | 1.180 | 0.960 | 2.9 |
| HD 44391 | K0 Ib | 1.400 | 1.180 | 0.220 | 0.7 |
| HD 9852 | K0.5 III CN1 | 1.460 | 1.050 | 0.410 | 1.2 |
| HD 164349 | K0.5 IIb | 1.257 | 1.100 | 0.157 | 0.5 |
| HD 179870 | K0 II | 1.245 | 1.060 | 0.185 | 0.6 |
| HD 124897 | K1.5 III Fe−0.5 | 1.231 | 1.120 | 0.111 | 0.3 |
| HD 63302 | K1 Ia−Iab | 1.752 | 1.200 | 0.552 | 1.7 |
| HD 124897 | K1.5 III Fe−0.5 | 1.231 | 1.120 | 0.111 | 0.3 |
| HD 23082 | K2.5 II | 1.850 | 1.350 | 0.500 | 1.5 |
| HD 132935 | K2 III | 1.364 | 1.160 | 0.204 | 0.6 |
| HD 212466 | K2 O−Ia | 2.275 | 1.230 | 1.045 | 3.1 |
| HD 221246 | K3 III | 1.460 | 1.260 | 0.200 | 0.6 |
| HD 187238 | K3 Iab−Ib | 2.040 | 1.420 | 0.620 | 1.9 |
| HD 16068 | K3 II−III | 1.790 | 1.260 | 0.530 | 1.6 |
| HD 35620 | K3 III Fe1 | 1.403 | 1.260 | 0.143 | 0.4 |
| HD 178208 | K3 III | 1.393 | 1.260 | 0.133 | 0.4 |
| HD 99998 | K3+III Fe−0.5 | 1.531 | 1.260 | 0.271 | 0.8 |
| HD 185622 | K4 Ib | 2.026 | 1.500 | 0.526 | 1.6 |
| HD 201065 | K4 Ib−II | 1.793 | 1.460 | 0.333 | 1.0 |
| HD 207991 | K4− III | 1.600 | 1.430 | 0.170 | 0.5 |
| HD 45977 | K4 V | 1.120 | 1.000 | 0.120 | 0.4 |
| HD 216946 | K5 Ib | 1.773 | 1.600 | 0.173 | 0.5 |
| HD 181475 | K7 IIa | 2.070 | 1.520 | 0.550 | 1.6 |
| HD 236697 | M0.5 Ib | 2.157 | 1.650 | 0.507 | 1.5 |
| HD 35601 | M1.5 Iab−Ib | 2.200 | 1.650 | 0.550 | 1.7 |
| HD 39801 | M1−M2 Ia−Iab | 1.861 | 1.650 | 0.211 | 0.6 |
| HD 14404 | M1− Iab−Ib | 2.303 | 1.650 | 0.653 | 2.0 |
| HD 339034 | M1 Ia | 3.036 | 1.650 | 1.386 | 4.2 |
| BD+60 265 | M1.5 Ib | 2.345 | 1.650 | 0.695 | 2.1 |
| HD 10465 | M2 Ib | 1.860 | 1.650 | 0.210 | 0.6 |
| HD 206936 | M2− Ia | 2.327 | 1.650 | 0.677 | 2.0 |
| HD 23475 | M2 II | 1.877 | 1.590 | 0.287 | 0.9 |
| CD −31 4916 | M3 Iab−Ia | 2.238 | 1.670 | 0.568 | 1.7 |
| HD 14469 | M3−M4 Iab | 2.175 | 1.670 | 0.505 | 1.5 |
| HD 28487 | M3.5 III Ca−0.5 | 1.740 | 1.620 | 0.120 | 0.4 |
| HD 14488 | M3.5 Iab Fe−1 var? | 2.256 | 1.710 | 0.546 | 1.6 |
| HD 39045 | M3 III | 1.752 | 1.600 | 0.152 | 0.5 |
| RW Cyg | M3 to M4 Ia−Iab | 2.881 | 1.670 | 1.211 | 3.6 |
| Gl 299 | M4 V | 1.768 | 1.650 | 0.118 | 0.4 |
| Gl 866ABC | M5 V | 1.960 | 1.800 | 0.160 | 0.5 |
The reddening-corrected spectrum fcorλ(λ) is given by

where fλ(λ) is the absolute flux calibrated spectrum and Aλ is the extinction law as a function of wavelength. We adopted the NIR law given by Fitzpatrick & Massa (2007) with RV = 3.0. For this law,

We note that these dereddened spectra should be used with care because the dereddening process assumes an intrinsic stellar color and a mean Galactic extinction law that may not be accurate or appropriate in all cases. For example, we find E(B − V) = 0.06 (or AV = 0.18) for the M6 dwarf Gl 406, which resides at a distance of only 2.4 pc (van Altena et al. 1995). No significant extinction is expected at this distance. In addition, M giant stars and PAGB and TPAGB stars may have local extinction due to dust formation in their cool outer atmospheres, which is difficult to separate for any interstellar extinction that may be present. Variable stars are also problematic due to changes in the intrinsic color. Therefore, unless otherwise noted, we will continue to use the uncorrected spectra in the remainder of the analysis, including the figures. Nevertheless, the dereddened spectra are available on the IRTF Web site (see footnote 4).
We have found that the observed spectral slope from any given object varies slightly between individual observations. An example of this small effect is illustrated in Figure 4. In order to quantify this effect, we have computed the differences (ΔX−Y = (X − Y)obs − (X − Y)synth) between the colors derived from the 2MASS photometry and those derived from synthetic photometry on our observed spectra. The synthetic color for any two of the 2MASS bandpasses is given by
where the symbols have the same meaning as in Equation (1). The results for the 53 stars with relatively good (5%) 2MASS photometry (from Table 2) are plotted in Figure 5. The average differences are 〈ΔJ−H〉 = 0.00 ± 0.04 (RMS),  , and
, and  . Although the colors derived from the 2MASS photometry are not as precise as those measured from the spectra via synthetic photometry (better than 1%), the photometric residuals on the sample of 53 cool stars indicate that our measurements of spectral slope are accurate to within a few percent for F, G, K, and M spectral types. Similar (but larger) effects have been observed by Goto et al. (2003) while using adaptive optics with medium resolution spectroscopy. Their simulations demonstrate that spectral slope variations result from changes in the fraction of light from the object transmitted by a finite width slit as a function of wavelength. Therefore, temporal changes in seeing, guiding, and differential atmospheric refraction are probably the cause of the small variations we observe. Although SpeX does not have an atmospheric dispersion corrector, we minimized the effects of differential refraction (and therefore the wavelength-dependent light loss through the slit) by moving the internal image rotator to observe at the parallactic angle (see Figure 6 of Rayner et al. 2004) and by combining multiple spectra together.
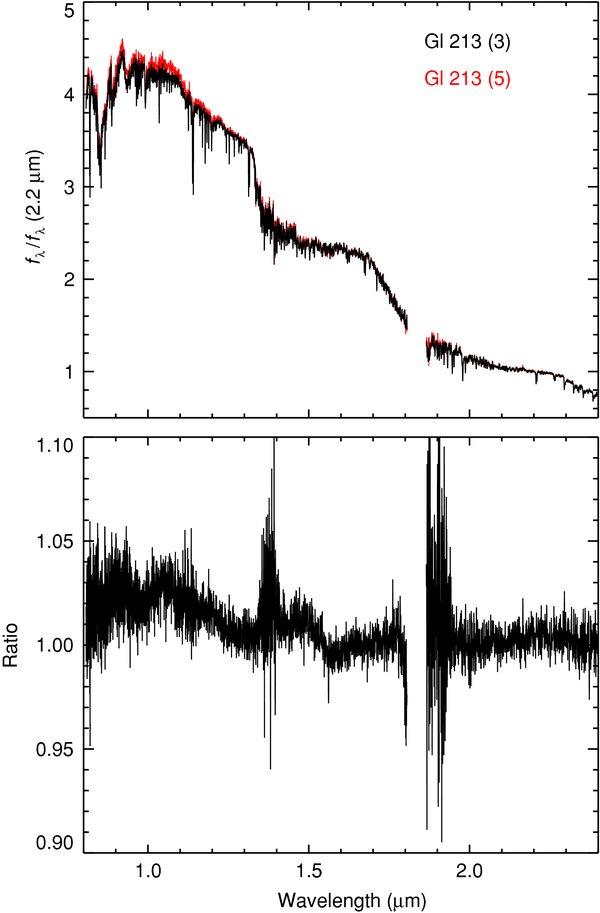
Figure 4. Top: the third (black) and fifth (red) spectra in a sequence of ten consecutive spectra of Gl 213 (M4 V). These two spectra show the largest slope difference in the sequence. The difference is equivalent to J − KS = 0.015. Bottom: the flux ratio of the two spectra showing that the difference in slope is small across the range 0.8–2.4 μm. As described in Section 2.3 we can measure spectral slopes (i.e., photometric colors) accurate to a few percent.
Download figure:
Standard image High-resolution image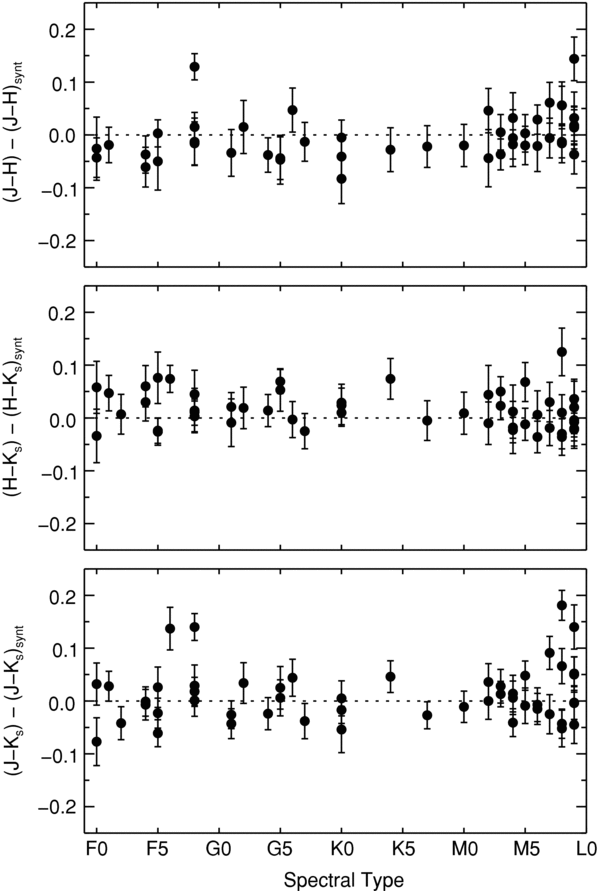
Figure 5. Computed residuals (observed−synthetic) between the observed and synthesized 2MASS J − H, H − KS, and J − KS colors of 53 library stars with relatively good (5%) 2MASS photometry. The average residuals are 〈ΔJ−H〉 = 0.00 ± 0.04 (rms),  (rms), and
  (rms). The plotted error bars show the 2MASS error in magnitudes. The error on the synthetic color is insignificant by comparison. The residuals imply that the measured spectral slope of these cool stars is accurate to within a few percent.
Download figure:
Standard image High-resolution imageAs a further test of the accuracy of the spectral slopes, we have computed the synthetic Z − Y, Y − J, J − H, H − K, and K − L' colors of eight A0 V stars observed with the same instrumental setup. The synthetic color for any two bandpasses X and Y is given by
where fλ(λ) is the flux density of the object, fVegaλ(λ) is the flux density of Vega, and S(λ) is the system response function for each bandpass that we assume to be given by the product of the filter transmission and the atmospheric transmission. Equation (5) assumes that Vega has zero color in all passband combinations. We used the Wide Field Camera (WFCAM; Casali et al. 2007) ZYJHK filter profiles that include the atmospheric transmission at an airmass of 1.3 with a precipitable water vapor content of 1.0 mm (Hewett et al. 2006). The Z and Y bands are custom filters designed for the UKIRT Infrared Deep Sky Survey (UKIDSS; Lawrence et al. 2007) centered at ∼0.88 and ∼1.03 μm, while the JHK bands were constructed to the specifications of the Mauna Kea Observatories Near-Infrared (MKO-NIR) filter set (Tokunaga et al. 2002). We constructed an L' system response function using the MKO-NIR L'-band filter profile and ATRAN (Lord 1992) to calculate the atmospheric transmission under the same atmospheric conditions. For fVegaλ(λ) we used a Kurucz model of Vega (Teff = 9550 K, log g = 3.950, vrot = 25 km s−1, and vturb = 2 km s−1), scaled to the flux density at λ = 5556 Å given by Mégessier (1995). The factors of λ inside the integrals convert the energy flux densities fλ to photon flux densities, which ensures that the integrated fluxes are proportional to the observed photon count rate (e.g., Koornneef et al. 1986; Buser & Kurucz 1992).
The mean colors of the eight A0 V stars are 〈Z − Y〉 = −0.015 ± 0.007 (rms), 〈Y − J〉 = 0.007 ± 0.006 (rms), 〈J − H〉 = 0.019 ± 0.005 (rms), 〈H − K〉 = −0.005 ± 0.004, and 〈K − L'〉 = −0.001 ± 0.010. Given that we expect the mean colors to be zero, the mean colors of the A0V stars represent the precision in our ability to measure spectral slope. Taken together, the 2MASS and A0V star photometry indicates that we can measure spectral slope to within a few percent. Finally, slope variations introduced due to uncertainties in the spectral types of the A0 V standard stars are small since an uncertainty of a 0.5 subtype at A0 is equivalent to δJ−H = 0.003, δH−K = 0.005, and  (Cox 2000).
3. DATA AND ANALYSIS
3.1. The Spectra
Digital versions of the spectra are available at the IRTF Web site, which contains a full description of the data products. The data are available in text or Spextool FITS format and files can be downloaded individually or bundled together in a tar file. The files contain wavelength, flux, and error. The errors include the photon Poisson noise and read noise (Vacca et al. 2004) for both the object and the associated telluric standard, which are then propagated through each step of the reduction process. The file headers contain more information (including object name, epoch, spectral type, observing modes, 2MASS JHK magnitudes, measured radial velocity, flux, and wavelength units). As an example, the flux and S/N spectra of HD 63302 (K1 1a–Iab) and HD 10696 (G3 V) are shown in Figure 6. We estimate that the actual S/N in our fully reduced stellar spectra is limited to less than 1000 by systematic errors in the flat field measurement even though the formal S/N can be greater than 1000. Also, systematic errors in telluric correction (e.g., if the airmasses of an object and standard star are not ideally matched), systematic errors in the slope, as well as any errors in the spectral type of the A0 V telluric standard are not accounted for in the formal S/N estimate (see Figure 6).
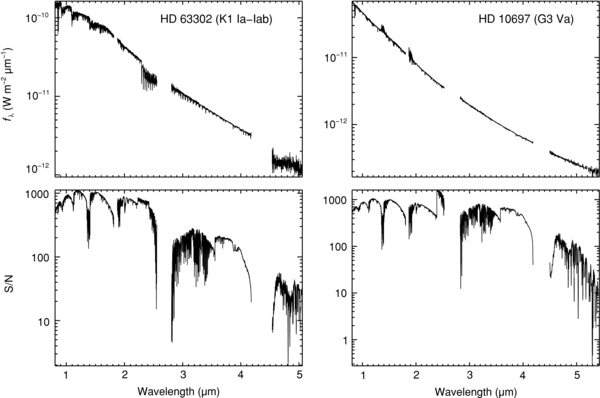
Figure 6. Left: the flux and S/N spectra of HD 63302 (K1 Ia–Iab). Telluric correction is excellent. Right: the flux and S/N spectra of HD 10697 (G3 Va). Note the flux error in the spectrum at ∼1.9 μm and ∼1.4 μm despite the fact that the S/N > 100. This is due to relatively poor telluric correction in these regions for this particular observation. Therefore, care must be taken in interpreting features in regions of high telluric contamination even if the S/N is high.
Download figure:
Standard image High-resolution imageRepresentative spectra, covering 0.8–5.0 μm, of dwarfs, giants, and supergiants in our sample are shown in Figures 7–9. Given the large wavelength range and the change in flux wavelength and spectral type, it is difficult to display the spectra at a scale that allows close examination of all of the interesting spectral features in one plot. For display purposes, we therefore use λfλ (normalized at the given wavelength) as a function of log λ. The plots show the general trend of spectral features with MK spectral type. Feature identifications and changes with spectral type are described in more detail in Sections 3.2–3.4.
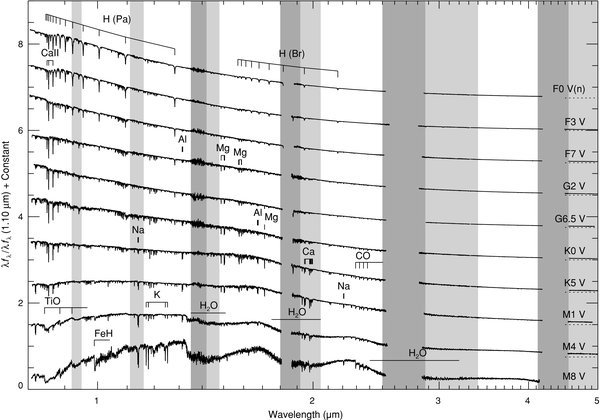
Figure 7. Dwarf sequence from 0.8–5 μm. The spectra are of HD 108159 (F0 V(n)), HD 26015 (F3 V), HD 126660 (F7 V), HD 76151 (G2 V), HD 115617 (G6.5 V), HD 145675 (K0 V), HD 36003 (K5 V), HD 42581 (M1 V), Gl 213 (M4 V), and Gl 752B (M8 V). The spectra have been normalized to unity at 1.10 μm and offset by constants (dotted lines). Regions of strong (transmission <20%) telluric absorption are shown in dark gray, while regions of moderate (transmission <80%) telluric absorption are shown in light gray.
Download figure:
Standard image High-resolution image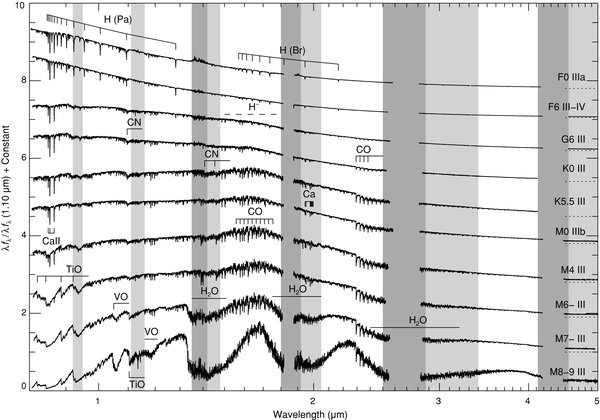
Figure 8. Giant sequence from 0.8–5 μm. The spectra are of HD 89025 (F0 IIIa), HD 160365 (F6 III–IV), HD 27277 (G6 III), HD 100006 (K0 III), HD 120477 (K5.5 III), HD 213893 (M0 IIIb), HD 4408 (M4 III), HD 18191 (M6− III), HD 108849 (M7− III), and IRAS 21284 − 0747 (M8–9 III). The spectra have been normalized to unity at 1.10 μm and offset by constants (dotted lines). Regions of strong (transmission <20%) telluric absorption are shown in dark gray, while regions of moderate (transmission <80%) telluric absorption are shown in light gray.
Download figure:
Standard image High-resolution image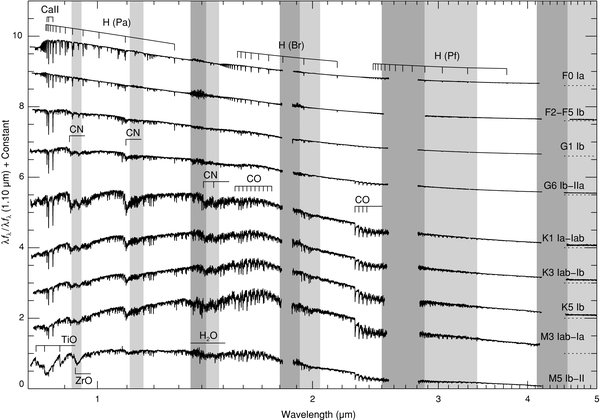
Figure 9. Supergiant sequence from 0.8–5.0 μm. The spectra are of HD 7927 (F0 Ia), BD +38 2803 (F2–F5 Ib), HD 74395 (G1 Ib), HD 202314 (G6 Ib–IIa Ca1 Ba0.5), HD 63302 (K1 Ia–Iab), HD 187238 (K3 Iab–Ib), HD 216946 (K5 Ib Ca1 Ba0.5), CD −31 4916 (M3 Iab–Ia), and HD 156014 (M5 Ib–II). The spectra have been normalized to unity at 1.10 μm and offset by constants (dotted lines). Regions of strong (transmission <20%) telluric absorption are shown in dark gray, while regions of moderate (transmission <80%) telluric absorption are shown in light gray.
Download figure:
Standard image High-resolution imageIt should be noted that MK spectral classification is based on comparing an optical spectrum with a set of stars (anchor points) that define certain spectral types. Therefore it is not necessarily the case that the trends in NIR spectral features will follow the optical types. Also, the exact numbers for the effective temperature, surface gravity, and composition (i.e., metallicity) are model dependent (i.e., not directly observable) and will change as models improve. Although there are no formal MK classification criteria for the NIR, much work has been conducted on NIR spectral classification. The pioneering study on cool stars was done by Kleinmann & Hall (1986), who identified a number of temperature and luminosity sensitive atomic (Na i, Ca i, Br γ) and molecular (CO, H2O) features in the K band. Subsequent studies developed a variety of spectral type versus EW indices for cool stars. Notable examples among these are the studies by Origlia et al. (1993), Dallier et al. (1996), Meyer et al. (1998), Ramírez et al. (1997), Förster Schreiber (2000), Gorlova et al. (2003), Davies et al. (2007), Ivanov et al. (2004), and Mármol-Queraltó et al. (2008). We do not propose to add to these and other NIR classification schemes but present the IRTF Spectral Library as a resource for further investigation. The examples of EWs of several prominent features in data as a function of spectral type and luminosity are, however, presented in Section 4.1.
As an example of the mismatches in the trends of the NIR spectral features with MK type, Figure 10 shows a spectral sequence of K giant stars from 0.8 to 2.45 μm based on their MK types. From the trend in the overall spectral shape and depth of the first overtone vibration–rotation bands of CO in the K band (∼2.29–2.5 μm), two of the stars appear out of sequence (they are bluer and with shallower CO absorption than expected) and should appear earlier in the sequence by about one spectral subtype. When the stars are corrected for reddening (see Figure 11 and Table 5), the sequence of spectral shapes behaves as expected but the CO band depths still appear to be out of sequence. A possible explanation is that these stars are slightly metal poor (see, for example, Mármol-Queraltó et al. 2008). However, this explanation is inconsistent with the assigned MK spectral types: one star being of approximately solar metallicity (HD 137759, K2 III) and the other star being slightly metal rich (HD 114960, K3.5 IIIb CN0.5 CH0.5), although neither star has a formal [Fe/H] measurement. Another possibility is the uncertainty in assigning the MK spectral type as discussed in Section 2.1. Given these uncertainties, spectral classification using the IRTF Spectral Library is probably best done by comparing a given stellar spectrum of an unknown type with an ensemble of spectra for a sequence of MK types, rather than trying to find the closest individual spectral match. The effect of reddening should also be considered.
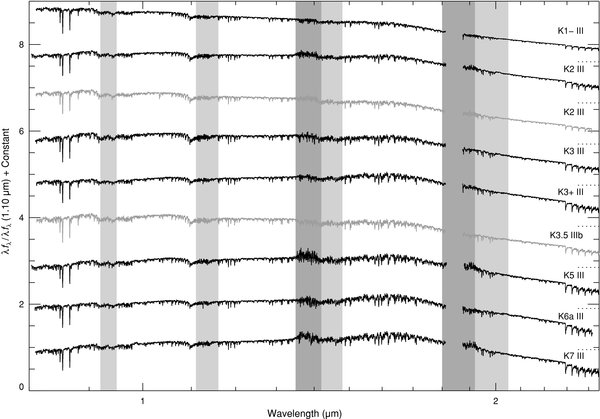
Figure 10. K giant sequence from 0.8–2.45 μm. The stars are HD 36124 (K1− III Fe-0.5), HD 132935 (K2 III), HD 137759 (K2 III), HD 221246 (K3 III), HD 99998 (K3+ III Fe−0.5), HD 114960 (K3.5 IIIb CN0.5 CH0.5), HD 181596 (K5 III), HD 3346 (K6 IIIa), and HD 194193 (K7 III). Stars forming a smooth spectral sequence are plotted in black, while the two stars (HD 137759 and HD 114960), which appear slightly out of sequence (see Section 3.1), are plotted in gray.
Download figure:
Standard image High-resolution image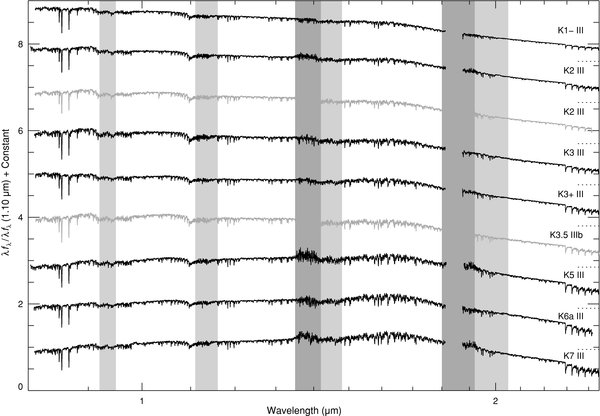
Figure 11. Same as Figure 11 except that the dereddened spectra are plotted. The spectral continuum shapes now behave as expected but the CO band depths (wavelengths ⩾2.29 μm) of the two stars HD 137759 and HD 114960 (plotted in gray) still appear slightly out of sequence (see Section 3.1).
Download figure:
Standard image High-resolution imagePlots of the dwarf sequences F3, F5, F9, G2, G8, K1, K7, M3, and M7 for the I, Y, J, H, K, and L bands, respectively, are shown in Figures 12–17. Luminosity effects at spectral types F, G, K, and M, across the 0.8–5 μm range, are shown in Figures 18–21. Plots showing luminosity effects at spectral types F5 and G6 for the I, Y, J, H, K, and L bands, respectively, are shown in Figures 22–27; likewise luminosity effects at spectral types K5 and M5 are shown in Figures 28–33. A 0.8–5 μm sequence of M, S, and C giants is plotted in Figure 34. All these spectra are discussed in more detail in the subsequent sections. More complete spectral sequences are given in the Appendix.
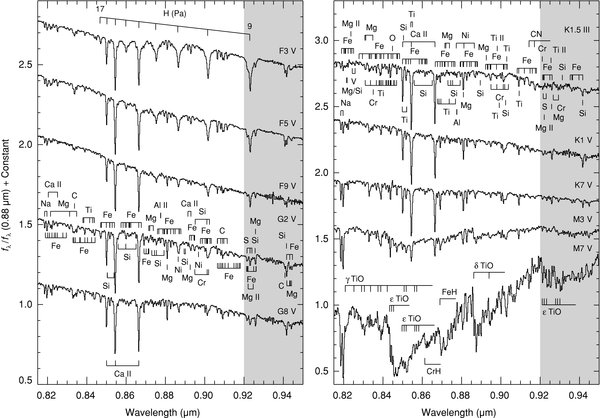
Figure 12. Sequence of F, G, K, and M dwarf stars plotted over the I band (0.82–0.95 μm). The spectra are of HD 26015 (F3 V), HD 27524 (F5 V), HD 165908 (F9 V metal weak), HD 76151 (G2 V), HD 101501 (G8 V), HD 10476 (K1 V), HD 237903 (K7 V), Gl 388 (M3 V), and Gl 644C (vB 8) (M7 V). The K1.5 III comparison star is Arcturus (HD 124897). The spectra have been normalized to unity at 0.88 μm and offset by constants.
Download figure:
Standard image High-resolution image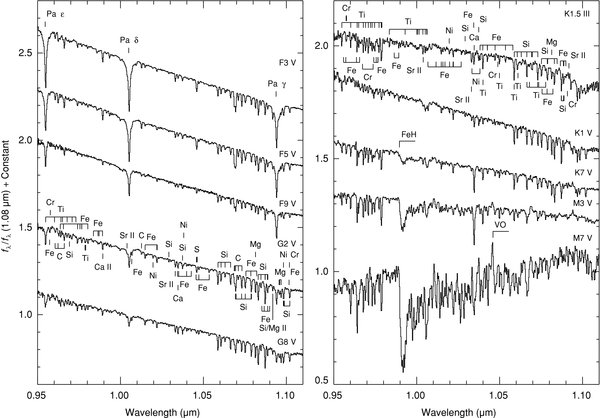
Figure 13. Same as Figure 12 except over the Y band (0.95–1.10 μm). The spectra have been normalized to unity at 1.08 μm and offset by constants.
Download figure:
Standard image High-resolution image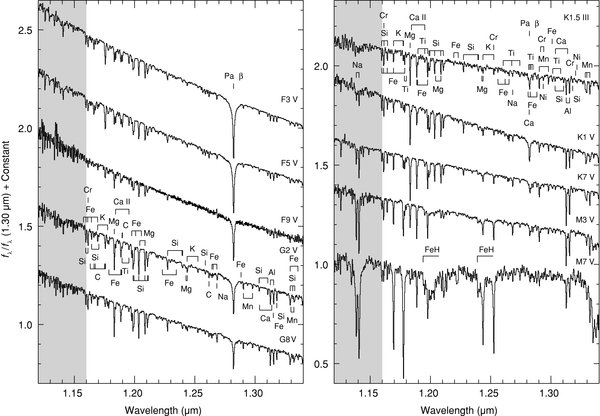
Figure 14. Same as Figure 12 except over the J band (1.12–1.34 μm). The spectra have been normalized to unity at 1.30 μm and offset by constants.
Download figure:
Standard image High-resolution image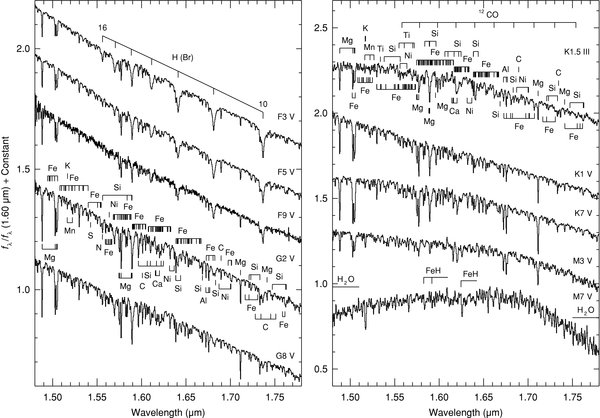
Figure 15. Same as Figure 12 except over the H band (1.48–1.78 μm). The spectra have been normalized to unity at 1.60 μm and offset by constants.
Download figure:
Standard image High-resolution image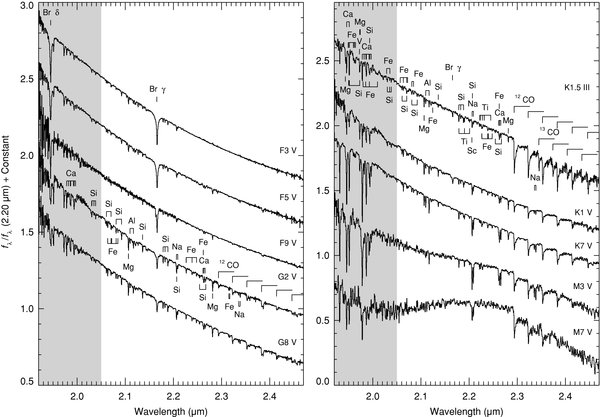
Figure 16. Same as Figure 12 except over the K band (1.92–2.5 μm). The spectra have been normalized to unity at 2.20 μm and offset by constants.
Download figure:
Standard image High-resolution image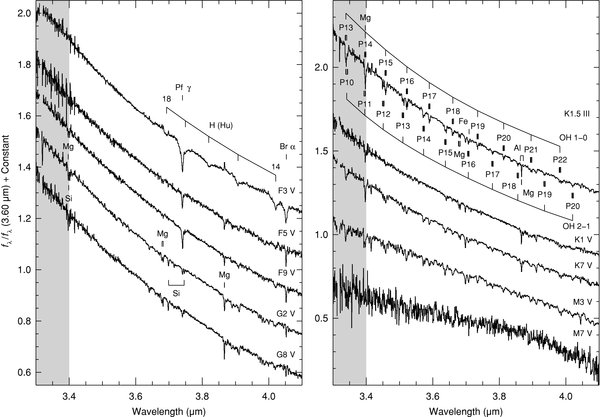
Figure 17. Same as Figure 12 except over the L band (3.3–4.2 μm). The spectra have been normalized to unity at 3.60 μm and offset by constants.
Download figure:
Standard image High-resolution image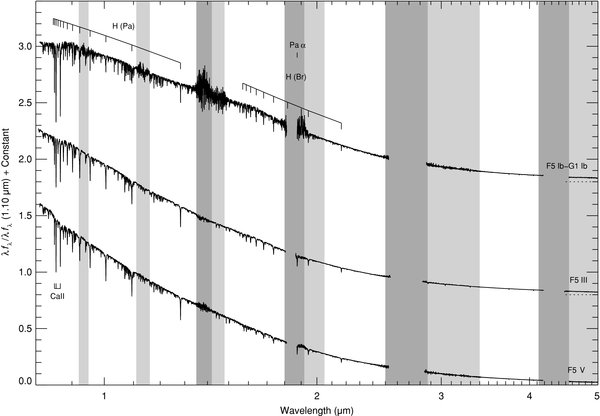
Figure 18. Luminosity effects at spectral type F. The spectra are of HD 27524 (F5 V), HD 17918 (F5 III), and HD 213306 (F5 Ib−G1 Ib) and have been normalized to unity at 1.10 μm and offset by constants (dotted lines). Regions of strong (transmission <20%) telluric absorption are shown in dark gray, while regions of moderate (transmission <80%) telluric absorption are shown in light gray.
Download figure:
Standard image High-resolution image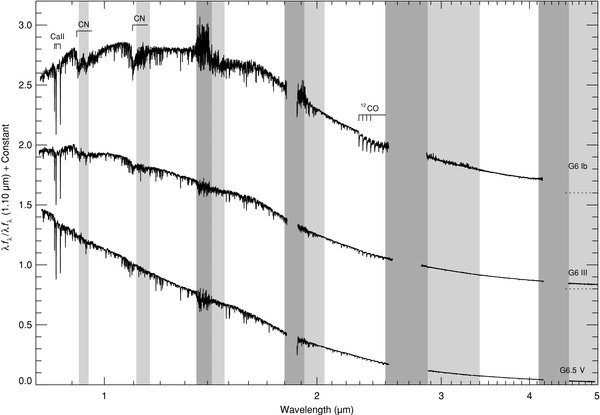
Figure 19. Luminosity effects at spectral type G. The spectra are of HD 115617 (G6.5 V), HD 27277 (G6 III), and HD 161664 (G6 Ib Hδ 1) and have been normalized to unity at 1.10 μm and offset by constants (dotted lines). Regions of strong (transmission <20%) telluric absorption are shown in dark gray, while regions of moderate (transmission <80%) telluric absorption are shown in light gray.
Download figure:
Standard image High-resolution image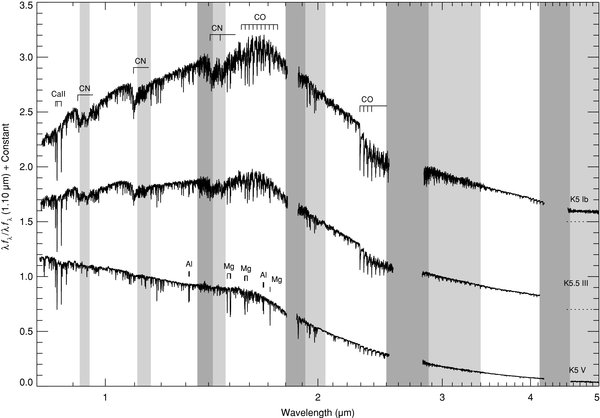
Figure 20. Luminosity effects at spectral type K. The spectra are of HD 36003 (K5 V), HD 120477 (K5.5 III), and HD 216946 (K5 Ib) and have been normalized to unity at 1.10 μm and offset by constants (dotted lines). Regions of strong (transmission <20%) telluric absorption are shown in dark gray, while regions of moderate (transmission <80%) telluric absorption are shown in light gray.
Download figure:
Standard image High-resolution image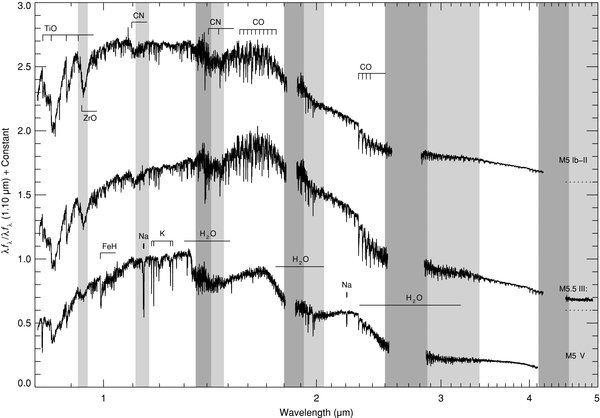
Figure 21. Luminosity effects at spectral type M. The spectra are of Gl 866ABC (M5 V), HD 94705 (M5.5 III:), and HD 156014 (M5 Ib–II) and have been normalized to unity at 1.10 μm and offset by constants (dotted lines). Regions of strong (transmission <20%) telluric absorption are shown in dark gray, while regions of moderate (transmission <80%) telluric absorption are shown in light gray.
Download figure:
Standard image High-resolution image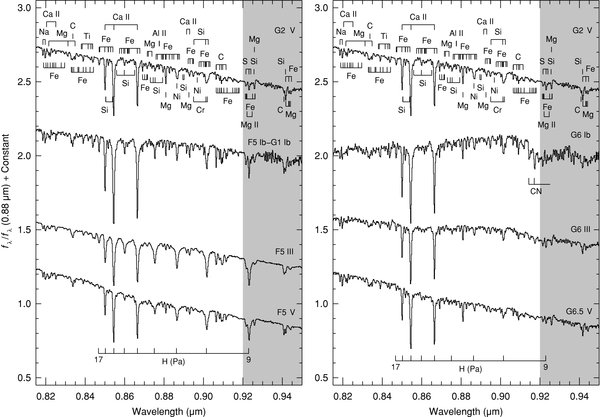
Figure 22. Luminosity effects at spectral types F5 (left) and G6 (right) plotted over the I band (0.82–0.95 μm). The spectra are of HD 213306 (F5 Ib–G1 Ib), HD 17918 (F5 III), HD 27524 (F5 V), HD 161664 (G6 Ib Hδ1), HD 27277 (G6 III), and HD 115617 (G6.5 V). The G2 V comparison star is HD 76151. The spectra have been normalized to unity at 0.88 μm and offset by constants.
Download figure:
Standard image High-resolution image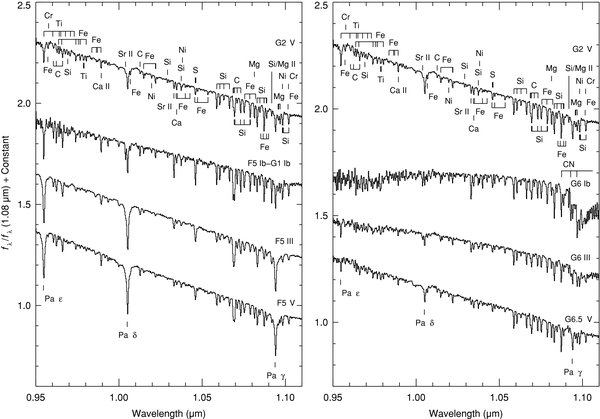
Figure 23. Same as Figure 22 except over the Y band. The spectra have been normalized to unity at 1.08 μm and offset by constants.
Download figure:
Standard image High-resolution image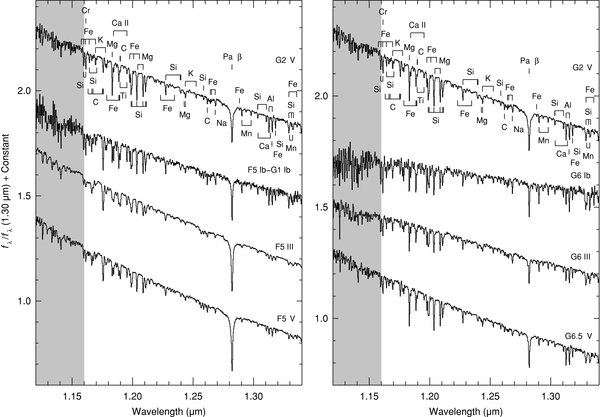
Figure 24. Same as Figure 22 except over the J band. The spectra have been normalized to unity at 1.30 μm and offset by constants.
Download figure:
Standard image High-resolution image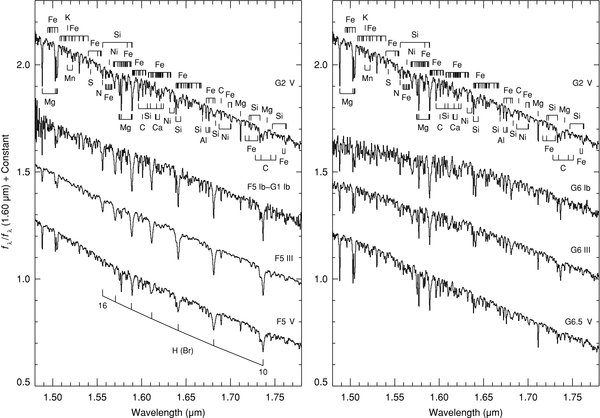
Figure 25. Same as Figure 22 except over the H band. The spectra have been normalized to unity at 1.60 μm and offset by constants.
Download figure:
Standard image High-resolution image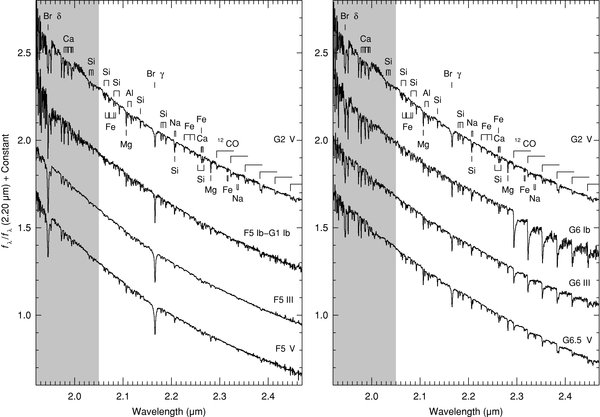
Figure 26. Same as Figure 22 except over the K band. The spectra have been normalized to unity at 2.20 μm and offset by constants.
Download figure:
Standard image High-resolution image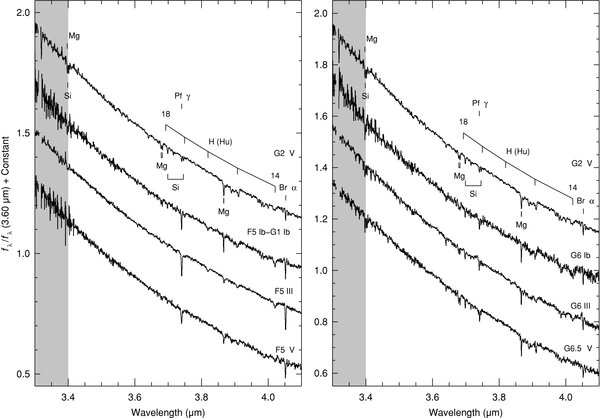
Figure 27. Same as Figure 22 except over the L band. The spectra have been normalized to unity at 3.60 μm and offset by constants.
Download figure:
Standard image High-resolution image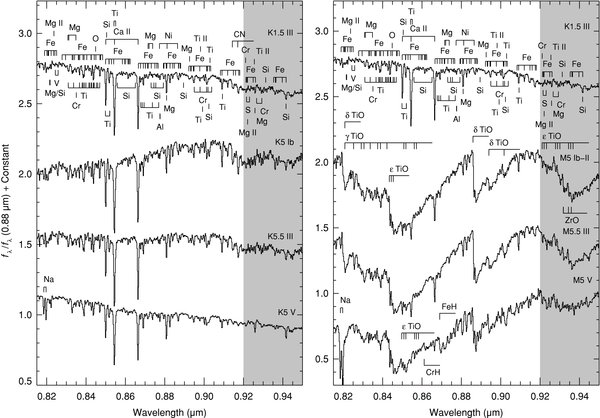
Figure 28. Luminosity effects at spectral types K5 (left) and M5 (right) plotted over the I band (0.82–0.95 μm). The spectra are of HD 216946 (K5 Ib), HD 120477 (K5.5 III), HD 36003 (K5 V), HD 156014 (M5 Ib–II), HD 94705 (M5.5 III:), and Gl 866ABC (M5 V). The K1.5 III comparison star is Arcturus (HD 124897). The spectra have been normalized to unity at 0.88 μm and offset by constants.
Download figure:
Standard image High-resolution image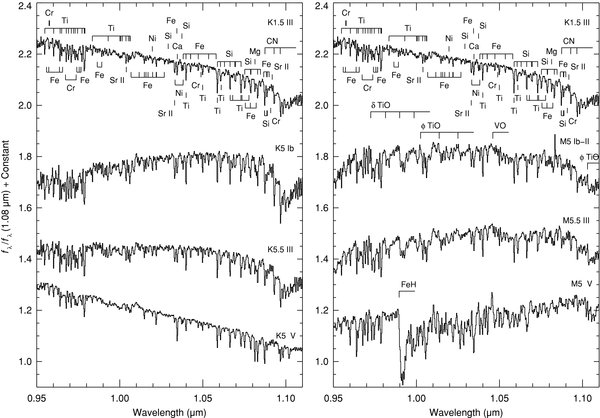
Figure 29. Same as Figure 28 except over the Y band. The spectra have been normalized to unity at 1.08 μm and offset by constants.
Download figure:
Standard image High-resolution image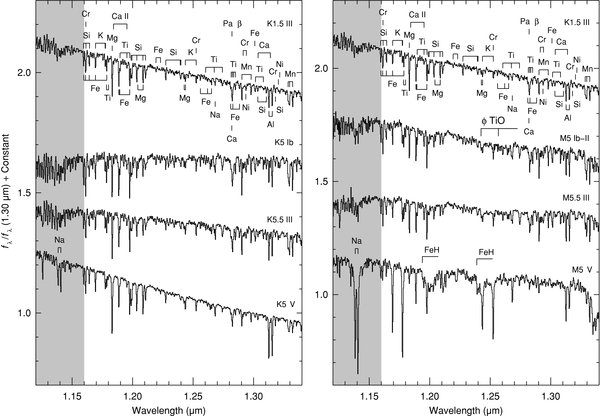
Figure 30. Same as Figure Same as Figure 28 except over the J band. The spectra have been normalized to unity at 1.30 μm and offset by constants.
Download figure:
Standard image High-resolution image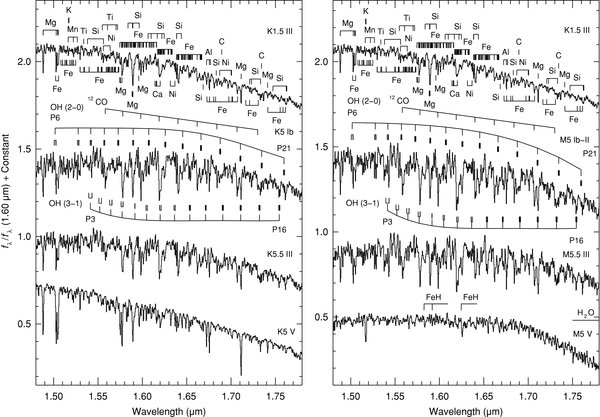
Figure 31. Same as Figure 28 except over the H band. The spectra have been normalized to unity at 1.60 μm and offset by constants.
Download figure:
Standard image High-resolution image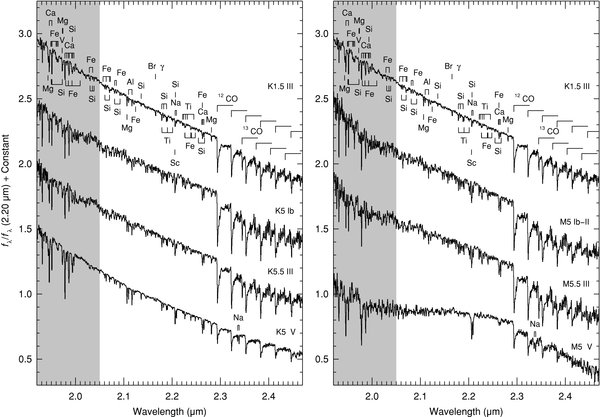
Figure 32. Same as Figure 28 except over the K band. The spectra have been normalized to unity at 2.20 μm and offset by constants.
Download figure:
Standard image High-resolution image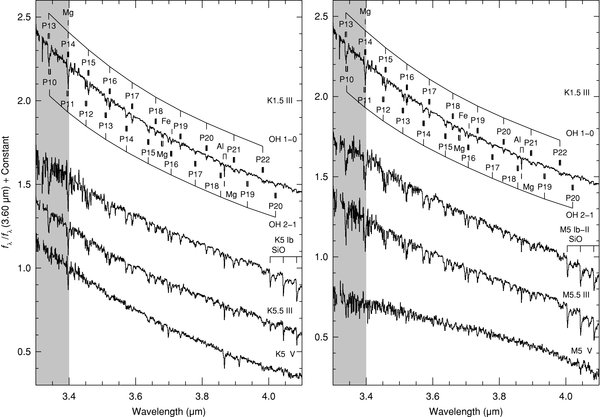
Figure 33. Same as Figure 28 except over the L band. The spectra have been normalized to unity at 3.60 μm and offset by constants.
Download figure:
Standard image High-resolution image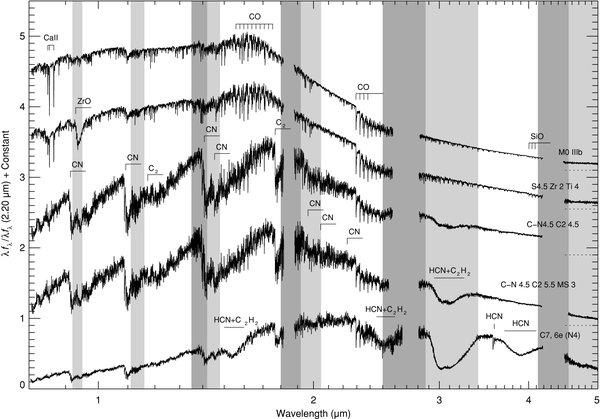
Figure 34. Sequence of M, S, and C giants of approximately the same effective temperature, illustrating the effects of increasing carbon abundance over oxygen during AGB evolution. The spectra are of HD 213893 (M0 IIIb), HD 64332 (S4.5 Zr 2 Ti 4), HD 92055 (C–N4.5 C2 4.5), and HD 76221 (C–N 4.5 C2 5.5 MS 3) and have been normalized to unity at 1.08 μm and offset by constants (dotted lines). Also plotted is the very cool carbon star R Lep (HD 31996, C7,6e (N4)). Regions of strong (transmission <20%) telluric absorption are shown in dark gray, while regions of moderate (transmission <80%) telluric absorption are shown in light gray.
Download figure:
Standard image High-resolution image3.2. Atomic Line Identifications
The S/N of the spectra is high enough that almost all of the absorption features seen in the spectra are real and not noise. However given that the resolving power of the spectra is R∼2000, the carriers of only the strongest and most isolated lines can be unambiguously identified. We therefore use the line identifications presented in the high-resolution (R ∼ 100000) spectral atlases of the solar photosphere (Wallace et al. 1993; Wallace & Livingston 2003) and Arcturus (K1.5 III; Hinkle et al. 1995, 2000). We selected only those absorption lines in the atlases with depths less than 0.8 (where the continuum has been normalized to unity) because weaker lines are only marginally detectable in our spectra.
Tables 6 and 7 list all atomic metal lines with depths less than 0.8 in the solar and Arcturus atlases, respectively. The wavelengths of the lines are in vacuum and were taken primarily from the atlases themselves. The revised solar atlas (Wallace & Livingston 2003) does not present the wavelengths of the lines, so we obtained them from an earlier version of the atlas (Livingston & Wallace 1991). A few of the lines in the revised atlas either lack identifications in the original atlas or have since been identified as being carried by two lines. We determined the wavelengths of these lines using the National Institute of Standards and Technology Atomic Spectra Database,7 the Atomic Line List,8 and the Fe i line list compiled by Nave et al. (1994). For several interesting atomic absorption lines we have calculated EW values for our sample of stars. Table 8 gives the EW definitions and Table 9 gives the EW values (see Section 4.1 for a discussion and Figure 35 for plots of prominent EWs).
Table 6. Strong Metal Lines in the Solar Spectrum
| Vacuum Wavelength (μm) | Element | Vacuum Wavelength (μm) | Element | Vacuum Wavelength (μm) | Element | Vacuum Wavelength (μm) | Element |
|---|---|---|---|---|---|---|---|
| 0.8185503 | Na i | 0.8189049 | Fe i | 0.8197077 | Na i | 0.8201178 | Fe i |
| 0.8203977 | Ca ii | 0.8209999 | Fe i | 0.8215293 | Mg i | 0.8222636 | Fe i |
| 0.8234587 | Fe i | 0.8241394 | Fe i | 0.8250417 | Fe i | 0.8251063 | Ca ii |
| 0.8278187 | Fe i | 0.8295802 | Fe i | 0.8312545 | Mg i | 0.8329342 | Fe i |
| 0.8334208 | Fe i | 0.8337440 | C i | 0.8341703 | Fe i | 0.8348416 | Mg i |
| 0.8363099 | Fe i | 0.8367942 | Fe i | 0.8380165 | Ti i | 0.8384830 | Ti i |
| 0.8390078 | Fe i | 0.8403729 | Fe i | 0.8414668 | Ti i | 0.8426453 | Fe i |
| 0.8428818 | Ti i | 0.8437274 | Ti i | 0.8437971 | Ti i | 0.8441896 | Fe i |
| 0.8446303 | Si i | 0.8448679 | O i | 0.8470736 | Fe i | 0.8474081 | Fe i |
| 0.8499332 | Fe i | 0.8500351 | Ca ii | 0.8503886 | Si i | 0.8504558 | Si i |
| 0.8516415 | Fe i | 0.8517452 | Fe i | 0.8529025 | Fe i | 0.8538507 | Si i |
| 0.8540359 | Fe i | 0.8544438 | Ca ii | 0.8559130 | Si i | 0.8574182 | Fe i |
| 0.8584627 | Fe i | 0.8595333 | Fe i | 0.8598319 | Si i | 0.8601196 | Fe i |
| 0.8614170 | Fe i | 0.8616300 | Fe i | 0.8618639 | Fe i | 0.8623976 | Fe i |
| 0.8650841 | Si i | 0.8664288 | Fe i | 0.8664520 | Ca ii | 0.8677128 | Fe i |
| 0.8691012 | Fe i | 0.8701834 | Fe i | 0.8712790 | Fe i | 0.8715083 | Mg i |
| 0.8715584 | Fe i | 0.8720220 | Mg i | 0.8730407 | Si i | 0.8738417 | Mg i |
| 0.8744852 | Si i | 0.8754413 | Si i | 0.8759590 | Fe i | 0.8766370 | Fe i |
| 0.8775278 | Al ii | 0.8776303 | Al ii | 0.8786852 | Fe i | 0.8792801 | Si i |
| 0.8792925 | Fe i | 0.8795756 | Fe i | 0.8807058 | Fe i | 0.8809176 | Mg i |
| 0.8810580 | Fe i | 0.8826647 | Fe i | 0.8840858 | Fe i | 0.8849166 | Fe i |
| 0.8864981 | Ni i | 0.8869392 | Fe i | 0.8870855 | Fe i | 0.8878464 | Fe i |
| 0.8895167 | Si i | 0.8901676 | Si i | 0.8914515 | Ca ii | 0.8922469 | Fe i |
| 0.8926021 | Mg i | 0.8929807 | Ca ii | 0.8931506 | Fe i | 0.8945528 | Fe i |
| 0.8947657 | Fe i | 0.8948706 | Fe i | 0.8949643 | Cr i | 0.8951550 | Si i |
| 0.8968393 | Ni i | 0.8977870 | Fe i | 0.9002026 | Fe i | 0.9009236 | Fe i |
| 0.9010844 | Fe i | 0.9010982 | Si i | 0.9012314 | Cr i | 0.9013069 | Fe i |
| 0.9019524 | Cr i | 0.9024057 | Si i | 0.9026843 | Fe i | 0.9033187 | Fe i |
| 0.9063915 | C i | 0.9064729 | Fe i | 0.9064950 | C i | 0.9072912 | Fe i |
| 0.9080772 | C i | 0.9082075 | Fe i | 0.9082858 | Fe i | 0.9090810 | Fe i |
| 0.9091000 | C i | 0.9091901 | Fe i | 0.9097327 | C i | 0.9102910 | Fe i |
| 0.9103157 | Fe i | 0.9114210 | C i | 0.9119636 | Fe i | 0.9148637 | Fe i |
| 0.9159606 | Fe i | 0.9167071 | Fe i | 0.9175726 | Fe i | 0.9181093 | Fe i |
| 0.9212557 | Fe i | 0.9215392 | S i | 0.9217023 | Fe i | 0.9220099 | Fe i |
| 0.9220780 | Mg ii | 0.9230627 | S i | 0.9240078 | S i | 0.9246802 | Mg ii |
| 0.9249094 | Fe i | 0.9171317 | Si i | 0.9258316 | Mg i | 0.9260811 | Fe i |
| 0.9261549 | Fe i | 0.9293024 | Cr i | 0.9320690 | Fe i | 0.9320776 | Si i |
| 0.9352980 | Fe i | 0.9361990 | Fe i | 0.9364927 | Fe i | 0.9375472 | Fe i |
| 0.9390756 | Fe i | 0.9397251 | Fe i | 0.9403693 | Fe i | 0.9408311 | C i |
| 0.9416090 | Si i | 0.9416630 | Fe i | 0.9417544 | Mg i | 0.9432405 | Mg i |
| 0.9432690 | Fe i | 0.9435351 | Mg i | 0.9441373 | Mg i | 0.9446394 | Fe i |
| 0.9449643 | Cr i | 0.9465610 | Fe i | 0.9515871 | Fe i | 0.9522640 | Ni i |
| 0.9548691 | Ti i | 0.9572529 | Fe i | 0.9576939 | Cr i | 0.9602228 | Ti i |
| 0.9605668 | C i | 0.9623435 | C i | 0.9636864 | Fe i | 0.9640942 | Ti i |
| 0.9650013 | Ti i | 0.9655762 | Fe i | 0.9661080 | C i | 0.9678200 | Ti i |
| 0.9692054 | Si i | 0.9708333 | Ti i | 0.9731082 | Ti i | 0.9741243 | Fe i |
| 0.9766045 | Fe i | 0.9766579 | Fe i | 0.9786000 | Ti i | 0.9790378 | Ti i |
| 0.9802999 | Fe i | 0.9836885 | Fe i | 0.9864443 | Fe i | 0.9870889 | Fe i |
| 0.9891745 | Fe i | 0.9893340 | Ca ii | 1.00394 | Sr ii | 1.00678 | Fe i |
| 1.01266 | C i | 1.01484 | Fe i | 1.01960 | Ni i | 1.02191 | Fe i |
| 1.02212 | Fe i | 1.02918 | Si i | 1.03301 | Sr ii | 1.03437 | Fe i |
| 1.03466 | Ca i | 1.03741 | Si i | 1.03814 | Ni i | 1.03986 | Fe i |
| 1.04266 | Fe i | 1.04556 | Fe i | 1.04583 | S i | 1.04596 | S i |
| 1.04623 | S i | 1.04725 | Fe i | 1.05351 | Fe i | 1.05880 | Si i |
| 1.06063 | Si i | 1.06306 | Si i | 1.06639 | Si i | 1.06860 | C i |
| 1.06883 | C i | 1.06926 | Si i | 1.06942 | C i | 1.06972 | Si i |
| 1.07103 | C i | 1.07304 | Si i | 1.07325 | C i | 1.07523 | Si i |
| 1.07560 | Fe i | 1.07860 | Fe i | 1.07875 | Si i | 1.07898 | Si i |
| 1.08140 | Mg i | 1.08213 | Fe i | 1.08301 | Si i | 1.08468 | Si i |
| 1.08524 | Fe i | 1.08665 | Fe i | 1.08718 | Si i | 1.07556 | Si i |
| 1.08858 | Si i | 1.08872 | Fe i | 1.08883 | Si i | 1.08993 | Fe i |
| 1.09172 | Mg ii | 1.09179 | Sr ii | 1.09563 | Mg i | 1.09603 | Mg i |
| 1.09684 | Mg i | 1.09823 | Si i | 1.09828 | Ni i | 1.09851 | Si i |
| 1.09875 | Si i | 1.10163 | Fe i | 1.10186 | Cr i | 1.10210 | Si i |
| 1.11228 | Fe i | 1.11600 | Cr i | 1.11906638 | Si i | 1.13115 | Si i |
| 1.133822 | C i | 1.13939 | Cr i | 1.14069 | Na i | 1.14255 | Fe i |
| 1.14423 | Fe i | 1.14878 | Cr i | 1.15059 | Si i | 1.15757 | Fe i |
| 1.15947 | Si i | 1.15955 | Si i | 1.15963 | Fe i | 1.16107 | Fe i |
| 1.16137 | Cr i | 1.16143 | Si i | 1.16320 | C i | 1.16414 | Fe i |
| 1.16442 | Si i | 1.16629 | C i | 1.16728 | C i | 1.16932 | Fe i |
| 1.16934 | K i | 1.17035 | Si i | 1.17514 | C i | 1.17565 | C i |
| 1.17580 | C i | 1.17761 | K i | 1.17865 | Fe i | 1.18314 | Mg i |
| 1.18422 | Ca ii | 1.18861 | Fe i | 1.18873 | Fe i | 1.18937 | Fe i |
| 1.1896124 | Ti i | 1.189617 | C i | 1.18990 | C i | 1.19530 | Ca ii |
| 1.19763 | Fe i | 1.19875 | Si i | 1.19949 | Si i | 1.2008834 | Fe i |
| 1.2008685 | Fe i | 1.20348 | Si i | 1.20431 | Mg i | 1.20564 | Fe i |
| 1.20853 | Si i | 1.20866 | Mg i | 1.20870 | Mg i | 1.21068 | Si i |
| 1.21140 | Si i | 1.22305 | Fe i | 1.22740 | Si i | 1.23463 | Fe i |
| 1.23936 | Si i | 1.23992 | Si i | 1.24264 | Mg i | 1.24356 | K i |
| 1.24369 | Mg i | 1.25255 | K i | 1.25874 | Si i | 1.26175 | C i |
| 1.26422 | Fe i | 1.26522 | Fe i | 1.26826 | Na i | 1.28106 | Fe i |
| 1.28833 | Fe i | 1.29034 | Mn i | 1.29795 | Mn i | 1.30331 | Si i |
| 1.30345 | Si i | 1.30371 | Ca i | 1.31056 | Si i | 1.31270 | Al i |
| 1.31386 | Ca i | 1.31515 | Fe i | 1.31544 | Al i | 1.31805 | Si i |
| 1.32912 | Si i | 1.32915 | Fe i | 1.32975 | Mn i | 1.33127 | Si i |
| 1.33227 | Mn i | 1.33297 | Si i | 1.33558 | Fe i | 1.33958 | Fe i |
| 1.34359 | Ni i | 1.48761 | Ni i | 1.4881595 | Mg i | 1.4881674 | Mg i |
| 1.4881847 | Mg i | 1.4882243 | Mg i | 1.49015 | Fe i | 1.49422 | Fe i |
| 1.49602 | Fe i | 1.49633 | Fe i | 1.49929 | Fe i | 1.50218 | Fe i |
| 1.50291 | Mg i | 1.50218 | Mg i | 1.50518 | Mg i | 1.50559 | Fe i |
| 1.50814 | Fe i | 1.50988 | Fe i | 1.51000 | Fe i | 1.51265 | Fe i |
| 1.51403 | Fe i | 1.51482 | Fe i | 1.51633 | Mn i | 1.51672 | K i |
| 1.51725 | K i | 1.51824 | Fe i | 1.52117 | Fe i | 1.52219 | Mn i |
| 1.52238 | Fe i | 1.52491 | Fe i | 1.52973 | Fe i | 1.52987 | Fe i |
| 1.52991 | Fe i | 1.53396 | Fe i | 1.53480 | Fe i | 1.53811 | Si i |
| 1.53989 | Fe i | 1.53999 | Fe i | 1.54265 | Si i | 1.55050 | Fe i |
| 1.55056 | Fe i | 1.55360 | Fe i | 1.55385 | Fe i | 1.55463 | Fe i |
| 1.55594 | Ni i | 1.55596 | Ni i | 1.55620 | Si i | 1.55925 | Fe i |
| 1.56085 | Fe i | 1.56259 | Fe i | 1.56362 | Fe i | 1.56369 | Ni i |
| 1.56571 | Fe i | 1.56663 | Fe i | 1.56818 | Fe i | 1.56907 | Fe i |
| 1.56961 | Fe i | 1.56970 | Fe i | 1.57279 | Fe i | 1.57450 | Mg i |
| 1.57462 | Fe i | 1.57533 | Mg i | 1.57656 | Fe i | 1.57701 | Mg i |
| 1.57737 | Fe i | 1.57759 | Fe i | 1.57784 | Fe i | 1.57933 | Fe i |
| 1.58029 | Fe i | 1.58145 | Fe i | 1.58225 | Fe i | 1.58235 | Fe i |
| 1.58379 | Si i | 1.58395 | Fe i | 1.58420 | Fe i | 1.48681 | Fe i |
| 1.58729 | Fe i | 1.58828 | Fe i | 1.58839 | Mg i | 1.58888 | Si i |
| 1.58905 | Mg i | 1.58921 | Fe i | 1.58928 | Si i | 1.58939 | Mg i |
| 1.58968 | Fe i | 1.58973 | Fe i | 1.58996 | Fe i | 1.59059 | Fe i |
| 1.59087 | Fe i | 1.59104 | Fe i | 1.59157 | Fe i | 1.59250 | Fe i |
| 1.59462 | Fe i | 1.59644 | Si i | 1.59692 | Fe i | 1.59720 | Fe i |
| 1.59851 | Fe i | 1.60021 | Fe i | 1.60092 | C i | 1.60111 | Fe i |
| 1.60115 | Fe i | 1.6012453 | Fe i | 1.60140 | Fe i | 1.60422 | Fe i |
| 1.60450 | Fe i | 1.60471 | Fe i | 1.60644 | Si i | 1.60758 | Fe i |
| 1.60803 | Fe i | 1.60992 | Si i | 1.61047 | Fe i | 1.61068 | Fe i |
| 1.61204 | Fe i | 1.61303 | Fe i | 1.61552 | Ca i | 1.61576 | Fe i |
| 1.61610 | Fe i | 1.61618 | Ca i | 1.61681 | Si i | 1.61695 | Fe i |
| 1.61794 | Fe i | 1.61840 | Fe i | 1.61853 | Fe i | 1.61902 | Fe i |
| 1.61995 | Fe i | 1.62015 | Ca i | 1.62029 | Fe i | 1.62087 | Fe i |
| 1.62122 | Fe i | 1.62180 | Fe i | 1.62201 | Si i | 1.62301 | Fe i |
| 1.62361 | Fe i | 1.62404 | Fe i | 1.62463 | Si i | 1.62892 | Fe i |
| 1.62973 | Fe i | 1.63149 | Ni i | 1.63208 | Fe i | 1.63231 | Fe i |
| 1.63289 | Fe i | 1.63675 | Ni i | 1.63846 | Si i | 1.63860 | Si i |
| 1.63867 | Fe i | 1.63989 | Fe i | 1.64026 | Fe i | 1.64091 | Fe i |
| 1.64123 | Fe i | 1.64394 | Si i | 1.64411 | Fe i | 1.64493 | Fe i |
| 1.64714 | Fe i | 1.64912 | Fe i | 1.65108 | Fe i | 1.65217 | Fe i |
| 1.65266 | Fe i | 1.65290 | Fe i | 1.65365 | Fe i | 1.65565 | Fe i |
| 1.65663 | Fe i | 1.66173 | Fe i | 1.66504 | Fe i | 1.66581 | Fe i |
| 1.66659 | Fe i | 1.66700 | Fe i | 1.66853 | Si i | 1.67235 | Al i |
| 1.67278 | Fe i | 1.67552 | Al i | 1.67576 | Fe i | 1.67679 | Al i |
| 1.68042 | Fe i | 1.68251 | Fe i | 1.68328 | Si i | 1.68719 | Ni i |
| 1.68950 | C i | 1.69746 | Fe i | 1.70009 | Ni i | 1.70057 | Ni i |
| 1.70101 | Fe i | 1.70157 | Fe i | 1.71133 | Mg i | 1.71658 | Fe i |
| 1.72090 | Fe i | 1.72105 | Si i | 1.72303 | Si i | 1.69862 | C i |
| 1.73010 | Fe i | 1.73321 | Si i | 1.73433 | C i | 1.74123 | Mg i |
| 1.74533 | C i | 1.74717 | Si i | 1.75104 | C i | 1.75853 | Fe i |
| 1.76135 | Fe i | 1.76219 | Si i | 1.76282 | Si i | 1.94583 | Ca i |
| 1.94897 | Fe i | 1.94987 | Si i | 1.95111 | Ca i | 1.95114 | Si i |
| 1.95135 | Si i | 1.97280 | Si i | 1.97822 | Ca i | 1.98204 | Ca i |
| 1.98585 | Ca i | 1.98676 | Ca i | 1.99226 | Ca i | 1.99344 | Si i |
| 1.99392 | Ca i | 1.99673 | Ca i | 2.03019 | Si i | 2.03075 | Si i |
| 2.03494 | Si i | 2.03840 | Si i | 2.06085 | Si i | 2.0635328 | Fe i |
| 2.0634902 | Fe i | 2.07040 | Fe i | 2.07043 | Si i | 2.07226 | Fe i |
| 2.08099 | Si i | 2.08107 | Fe i | 2.08465 | Fe i | 2.09224 | Si i |
| 2.10655 | Mg i | 2.10666 | Mg i | 2.10988 | Al i | 2.11696 | Al i |
| 2.13601 | Si i | 2.17857 | Si i | 2.18257 | Si i | 2.18853 | Si i |
| 2.20624 | Na i | 2.20688 | Si i | 2.20897 | Na i | 2.22632 | Fe i |
| 2.23869 | Fe i | 2.24794 | Fe i | 2.25438 | Si i | 2.26141 | Ca i |
| 2.26260 | Fe i | 2.26311 | Ca i | 2.26573 | Ca i | 2.26720 | Si i |
| 2.28142 | Mg i | 2.31509 | Fe i | 2.33548 | Na i | 2.33855 | Na i |
| 2.92882 | Ca i | 3.15174 | Si i | 3.39709 | Mg i | 3.40135 | Si i |
| 3.67901 | Mg i | 3.68263 | Mg i | 3.69866 | Si i | 3.74558 | Si i |
| 3.866486 | Mg i | 3.86681 | Mg i | 3.866874 | Mg i | 3.866945 | Mg i |
Table 7. Strong Metal Lines in the Arcturus Spectrum
| Vacuum Wavelength (μm) | Element | Vacuum Wavelength (μm) | Element | Vacuum Wavelength (μm) | Element | Vacuum Wavelength (μm) | Element |
|---|---|---|---|---|---|---|---|
| 0.8027028 | Ti i | 0.8030128 | Fe i | 0.8030499 | Fe i | 0.8048243 | Fe i |
| 0.8049814 | Fe i | 0.8056425 | Mg i | 0.8070439 | Ti i | 0.8072310 | Zr i |
| 0.8074360 | Fe i | 0.8077351 | Fe i | 0.8082752 | Fe i | 0.8087374 | Fe i |
| 0.8094836 | Cu i | 0.8095446 | Si i | 0.8095706 | V i | 0.8096137 | Co i |
| 0.8099087 | Fe i | 0.8100928 | Mg i | 0.8110530 | Fe i | 0.8114371 | Fe i |
| 0.8118973 | V i | 0.8135217 | Zr i | 0.8146790 | V i | 0.8163294 | V i |
| 0.8185480 | Na i | 0.8189032 | Fe i | 0.8197064 | Na i | 0.8201155 | Fe i |
| 0.8206336 | Fe i | 0.8207177 | Fe i | 0.8209977 | Fe i | 0.8215279 | Mg i |
| 0.8217390 | Si i | 0.8222621 | Fe i | 0.8234564 | Fe i | 0.8236885 | Mg ii |
| 0.8241376 | Fe i | 0.8243787 | V i | 0.8250378 | Fe i | 0.8258151 | V i |
| 0.8278146 | Fe i | 0.8295770 | Fe i | 0.8307854 | Mg i | 0.8309685 | Ti i |
| 0.8312525 | Mg i | 0.8329329 | Fe i | 0.8334191 | Fe i | 0.8336662 | Ti i |
| 0.8341673 | Fe i | 0.8348395 | Mg i | 0.8350545 | Cr i | 0.8360798 | Fe i |
| 0.8363079 | Fe i | 0.8366520 | Ti i | 0.8367910 | Fe i | 0.8380144 | Ti i |
| 0.8384535 | Fe i | 0.8384815 | Ti i | 0.8385065 | Ti i | 0.8390056 | Fe i |
| 0.8391777 | Ti i | 0.8399179 | Ti i | 0.8403690 | Fe i | 0.8414653 | Ti i |
| 0.8419245 | Ti i | 0.8425206 | Fe i | 0.8426436 | Fe i | 0.8426707 | Ti i |
| 0.8428797 | Ti i | 0.8437259 | Ti i | 0.8437950 | Ti i | 0.8441220 | Ti i |
| 0.8441871 | Fe i | 0.8448662 | O i | 0.8449943 | Fe i | 0.8453193 | Ti i |
| 0.8459405 | Ti i | 0.8469459 | Ti i | 0.8470719 | Fe i | 0.8474049 | Fe i |
| 0.8484293 | Fe i | 0.8498326 | Ti i | 0.8499307 | Fe i | 0.8500336 | Ca ii |
| 0.8504538 | Si i | 0.8516391 | Fe i | 0.8517432 | Fe i | 0.8520352 | Ti i |
| 0.8520672 | Ti i | 0.8528994 | Fe i | 0.8540337 | Fe i | 0.8541677 | Ti i |
| 0.8544418 | Ca ii | 0.8550420 | Ti i | 0.8559113 | Si i | 0.8584600 | Fe i |
| 0.8595293 | Fe i | 0.8601174 | Fe i | 0.8612958 | Fe i | 0.8614148 | Fe i |
| 0.8618629 | Fe i | 0.8623950 | Fe i | 0.8650827 | Si i | 0.8664501 | Ca ii |
| 0.8666082 | Fe i | 0.8677115 | Fe i | 0.8677735 | Ti i | 0.8685348 | Ti i |
| 0.8690998 | Fe i | 0.8694700 | Ti i | 0.8701081 | Fe i | 0.8701822 | Fe i |
| 0.8712764 | Fe i | 0.8715065 | Mg i | 0.8715575 | Fe i | 0.8720207 | Mg i |
| 0.8730389 | Si i | 0.8731530 | Fe i | 0.8737091 | Ti i | 0.8738401 | Mg i |
| 0.8744834 | Si i | 0.8749805 | Fe i | 0.8754395 | Si i | 0.8759578 | Fe i |
| 0.8766359 | Fe i | 0.8769070 | Ti i | 0.8773071 | Ni i | 0.8775262 | Al i |
| 0.8776281 | Al i | 0.8792786 | Si i | 0.8792915 | Fe i | 0.8795737 | Fe i |
| 0.8807030 | Fe i | 0.8809161 | Mg i | 0.8810571 | Fe i | 0.8811812 | Ni i |
| 0.8826625 | Fe i | 0.8840839 | Fe i | 0.8849152 | Fe i | 0.8864966 | Ni i |
| 0.8869347 | Fe i | 0.8870847 | Fe i | 0.8878439 | Fe i | 0.8880660 | Fe i |
| 0.8895155 | Si i | 0.8922441 | Fe i | 0.8926003 | Mg i | 0.8931514 | Fe i |
| 0.8934225 | Fe i | 0.8945497 | Fe i | 0.8947629 | Fe i | 0.8948699 | Fe i |
| 0.8949629 | Cr i | 0.8977847 | Fe i | 0.8979327 | Cr i | 0.8981617 | Ti ii |
| 0.8991901 | Ti i | 0.9012296 | Cr i | 0.9013046 | Fe i | 0.9014527 | Fe i |
| 0.9016438 | Fe i | 0.9019508 | Cr i | 0.9024039 | Si i | 0.9026830 | Fe i |
| 0.9029781 | Ti i | 0.9033171 | Fe i | 0.9038323 | Cr i | 0.9082865 | Fe i |
| 0.9090797 | Fe i | 0.9093169 | Ti i | 0.9119615 | Fe i | 0.9148623 | Fe i |
| 0.9159576 | Fe i | 0.9175701 | Fe i | 0.9181061 | Fe i | 0.9210801 | Cr i |
| 0.9212541 | Fe i | 0.9215371 | S i | 0.9217012 | Fe i | 0.9220072 | Fe i |
| 0.9220762 | Mg ii | 0.9230605 | S i | 0.9249080 | Fe i | 0.9255053 | Ti ii |
| 0.9258303 | Mg i | 0.9260793 | Fe i | 0.9266506 | Cr i | 0.9293002 | Cr i |
| 0.9148637 | Fe i | 0.9159606 | Fe i | 0.9167070 | Fe i | 0.9175726 | Fe i |
| 0.9181134 | Fe i | 0.9210817 | Cr i | 0.9212556 | Fe i | 0.9215392 | S i |
| 0.9217023 | Fe i | 0.9220099 | Fe i | 0.9230627 | S i | 0.9249094 | Fe i |
| 0.9258317 | Mg i | 0.9260811 | Fe i | 0.9261549 | Fe i | 0.9266518 | Cr i |
| 0.9293024 | Cr i | 0.9312817 | Si i | 0.9352979 | Fe i | 0.9361989 | Fe i |
| 0.9364927 | Fe i | 0.9397251 | Fe i | 0.9416090 | Si i | 0.9416630 | Fe i |
| 0.9417543 | Mg i | 0.9432690 | Fe i | 0.9435350 | Mg i | 0.9441373 | Mg i |
| 0.9449393 | Cr i | 0.9449643 | Cr i | 0.9456792 | Fe i | 0.9515871 | Fe i |
| 0.9522640 | Ni i | 0.9548691 | Ti i | 0.9559132 | Fe i | 0.9572530 | Fe i |
| 0.9574435 | Cr i | 0.9576939 | Cr i | 0.9602228 | Ti i | 0.9636863 | Fe i |
| 0.9640943 | Ti i | 0.9650013 | Ti i | 0.9655763 | Fe i | 0.9673135 | Cr i |
| 0.9678200 | Ti i | 0.9691528 | Ti i | 0.9708333 | Ti i | 0.9721622 | Ti i |
| 0.9731082 | Ti i | 0.9737231 | Cr i | 0.9741244 | Fe i | 0.9746277 | Ti i |
| 0.9749596 | Ti i | 0.9755765 | Fe i | 0.9766045 | Fe i | 0.9766579 | Fe i |
| 0.9772983 | Ti i | 0.9786000 | Ti i | 0.9786267 | Ti i | 0.9790378 | Ti i |
| 0.9802999 | Fe i | 0.9834844 | Ti i | 0.9864443 | Fe i | 0.9891744 | Fe i |
| 0.9930072 | Ti i | 1.0000700 | Ti i | 1.0005833 | Ti i | 1.0014491 | Ti i |
| 1.0037248 | Ti i | 1.0039405 | Sr ii | 1.0051583 | Ti i | 1.0060489 | Ti i |
| 1.0062660 | Ti i | 1.0067806 | Fe i | 1.0116788 | Fe i | 1.0148349 | Fe i |
| 1.0157956 | Fe i | 1.0170261 | Fe i | 1.0196018 | Ni i | 1.0197901 | Fe i |
| 1.0219150 | Fe i | 1.0221207 | Fe i | 1.0268037 | Fe i | 1.0291761 | Si i |
| 1.0330141 | Sr ii | 1.0333055 | Ni i | 1.0343722 | Fe i | 1.0346644 | Ca i |
| 1.0374111 | Si i | 1.0381445 | Ni i | 1.0381855 | Fe i | 1.0398643 | Fe i |
| 1.0399659 | Ti i | 1.0425887 | Fe i | 1.0426605 | Fe i | 1.0472531 | Fe i |
| 1.0489107 | Cr i | 1.0498997 | Ti i | 1.0535121 | Fe i | 1.0580062 | Fe i |
| 1.0587546 | Ti i | 1.0588038 | Si i | 1.0606332 | Si i | 1.0610631 | Ti i |
| 1.0630562 | Si i | 1.0663891 | Si i | 1.0664550 | Ti i | 1.0679972 | Ti i |
| 1.0692649 | Si i | 1.0697178 | Si i | 1.0729326 | Ti i | 1.0730350 | Si i |
| 1.0735811 | Ti i | 1.0752330 | Si i | 1.0755950 | Fe i | 1.0777825 | Ti i |
| 1.0786009 | Fe i | 1.0787510 | Si i | 1.0789814 | Si i | 1.0814048 | Mg i |
| 1.0821258 | Fe i | 1.0830059 | Si i | 1.0846822 | Si i | 1.0866494 | Fe i |
| 1.0871763 | Si i | 1.0872520 | Si i | 1.0884745 | Fe i | 1.0885787 | Si i |
| 1.0887246 | Fe i | 1.0888312 | Si i | 1.0899290 | Fe i | 1.0908706 | Cr i |
| 1.0917865 | Sr ii | 1.0956322 | Mg i | 1.0960310 | Mg i | 1.0968449 | Mg i |
| 1.0982314 | Si i | 1.0982832 | Ni i | 1.0985065 | Si i | 1.0987538 | Si i |
| 1.0990231 | Fe i | 1.1018567 | Cr i | 1.1020985 | Si i | 1.1122839 | Fe i |
| 1.1199913 | Si i | 1.1292922 | Si i | 1.1301955 | Si i | 1.1313826 | Cr i |
| 1.1359061 | Fe i | 1.1377194 | Fe i | 1.1384568 | Na i | 1.1393868 | Cr i |
| 1.1401185 | Cr i | 1.1406901 | Na i | 1.1425449 | Fe i | 1.1468461 | Fe i |
| 1.1509821 | Fe i | 1.1525394 | Mg i | 1.1594684 | Si i | 1.1596762 | Fe i |
| 1.1610750 | Fe i | 1.1613739 | Cr i | 1.1614279 | Si i | 1.1641448 | Fe i |
| 1.1644164 | Si i | 1.1693174 | Fe i | 1.1693404 | K i | 1.1772836 | K i |
| 1.1776053 | K i | 1.1783770 | Ti i | 1.1786489 | Fe i | 1.1800410 | Ti i |
| 1.1831409 | Mg i | 1.1842238 | Ca ii | 1.1886096 | Fe i | 1.1887335 | Fe i |
| 1.1893740 | Fe i | 1.1896127 | Ti i | 1.1952813 | Ti i | 1.1953015 | Ca ii |
| 1.1976326 | Fe i | 1.1977134 | Ti i | 1.1987475 | Si i | 1.1994848 | Si i |
| 1.2034808 | Si i | 1.2043117 | Mg i | 1.2085302 | Si i | 1.2086581 | Mg i |
| 1.2086955 | Mg i | 1.2106853 | Si i | 1.2193432 | Fe i | 1.2230455 | Fe i |
| 1.2274054 | Si i | 1.2393557 | Si i | 1.2399229 | Si i | 1.2426428 | Mg i |
| 1.2435646 | K i | 1.2436854 | Mg i | 1.2525237 | Cr i | 1.2525537 | K i |
| 1.2560430 | Fe i | 1.2603718 | Ti i | 1.2619374 | Fe i | 1.2652198 | Fe i |
| 1.2674569 | Ti i | 1.2682612 | Na i | 1.2741874 | Ti i | 1.2810649 | Fe i |
| 1.2814987 | Ti i | 1.2819546 | Ca i | 1.2821606 | H i | 1.2825179 | Ti i |
| 1.2828366 | Fe i | 1.2834942 | Ti i | 1.2850548 | Ti i | 1.2883288 | Fe i |
| 1.2903364 | Mn i | 1.2913619 | Cr i | 1.2935865 | Ni i | 1.2940556 | Cr i |
| 1.2979500 | Mn i | 1.3010241 | Fe i | 1.3015456 | Ti i | 1.3034537 | Si i |
| 1.3037132 | Ca i | 1.3080848 | Ti i | 1.3105651 | Si i | 1.3127033 | Al i |
| 1.3138542 | Ca i | 1.3151513 | Fe i | 1.3154383 | Al i | 1.3180501 | Si i |
| 1.3204755 | Cr i | 1.3216071 | Ni i | 1.3285099 | Mn i | 1.3285278 | Fe i |
| 1.3291215 | Si i | 1.3291460 | Fe i | 1.3297479 | Mn i | 1.3312743 | Si i |
| 1.3322705 | Mn i | 1.3329283 | Si i | 1.3355823 | Fe i | 1.3376334 | Ti i |
| 1.3393101 | Fe i | 1.3395761 | Fe i | 1.3419361 | Mn i | 1.3435909 | Ni i |
| 1.4992872 | Fe i | 1.5021801 | Fe i | 1.5029104 | Mg i | 1.5044355 | Mg i |
| 1.5051826 | Mg i | 1.5055858 | Fe i | 1.5081407 | Fe i | 1.5098820 | Fe i |
| 1.5099983 | Fe i | 1.5126510 | Fe i | 1.5140258 | Fe i | 1.5148195 | Fe i |
| 1.5163289 | Mn i | 1.5167234 | K i | 1.5172549 | K i | 1.5182400 | Fe i |
| 1.5198640 | Fe i | 1.5211682 | Fe i | 1.5221899 | Mn i | 1.5223777 | Fe i |
| 1.5249135 | Fe i | 1.5266664 | Mn i | 1.5297316 | Fe i | 1.5298738 | Fe i |
| 1.5339035 | Ti i | 1.5339574 | Fe i | 1.5347990 | Fe i | 1.5381089 | Si i |
| 1.5398877 | Fe i | 1.5399925 | Fe i | 1.5494567 | Fe i | 1.5505035 | Fe i |
| 1.5505557 | Fe i | 1.5535998 | Fe i | 1.5538487 | Fe i | 1.5546325 | Fe i |
| 1.5548002 | Ti i | 1.5559624 | Ni i | 1.5562042 | Si i | 1.5592519 | Fe i |
| 1.5595753 | Fe i | 1.5607105 | Ti i | 1.5608485 | Fe i | 1.5615399 | Fe i |
| 1.5617894 | Fe i | 1.5625923 | Fe i | 1.5636216 | Fe i | 1.5636895 | Ni i |
| 1.5652785 | Fe i | 1.5657146 | Fe i | 1.5666293 | Fe i | 1.5681803 | Fe i |
| 1.5690306 | Fe i | 1.5690727 | Fe i | 1.5696139 | Fe i | 1.5697035 | Fe i |
| 1.5703273 | Ti i | 1.5719864 | Ti i | 1.5727886 | Fe i | 1.5734056 | Fe i |
| 1.5745006 | Mg i | 1.5746226 | Fe i | 1.5753291 | Mg i | 1.5765617 | Fe i |
| 1.5768629 | Fe i | 1.5770147 | Mg i | 1.5773731 | Fe i | 1.5774924 | Fe i |
| 1.5778378 | Fe i | 1.5793310 | Fe i | 1.5802877 | Fe i | 1.5814452 | Fe i |
| 1.5822462 | Fe i | 1.5823454 | Fe i | 1.5826032 | Fe i | 1.5827140 | Fe i |
| 1.5837954 | Si i | 1.5839489 | Fe i | 1.5841107 | Ti i | 1.5841966 | Fe i |
| 1.5857646 | Fe i | 1.5868044 | Fe i | 1.5872858 | Fe i | 1.5882785 | Fe i |
| 1.5883902 | Mg i | 1.5888811 | Si i | 1.5890528 | Mg i | 1.5892781 | Si i |
| 1.5893862 | Mg i | 1.5897301 | Fe i | 1.5899568 | Fe i | 1.5902364 | Fe i |
| 1.5905859 | Fe i | 1.5908689 | Fe i | 1.5910387 | Fe i | 1.5915647 | Fe i |
| 1.5916936 | Fe i | 1.5924995 | Fe i | 1.5946201 | Fe i | 1.5958447 | Fe i |
| 1.5958813 | Mg i | 1.5964437 | Si i | 1.5966916 | Fe i | 1.5969226 | Fe i |
| 1.5972019 | Fe i | 1.5985088 | Fe i | 1.6002094 | Fe i | 1.6011125 | Fe i |
| 1.6011451 | Fe i | 1.6012459 | Fe i | 1.6013985 | Fe i | 1.6042203 | Fe i |
| 1.6045034 | Fe i | 1.6047096 | Fe i | 1.6064409 | Si i | 1.6075788 | Fe i |
| 1.6080309 | Fe i | 1.6093127 | Fe i | 1.6099193 | Si i | 1.6104678 | Fe i |
| 1.6106802 | Fe i | 1.6120366 | Fe i | 1.6130308 | Fe i | 1.6141232 | Ca i |
| 1.6155175 | Ca i | 1.6157657 | Fe i | 1.6160973 | Fe i | 1.6161778 | Ca i |
| 1.6168131 | Si i | 1.6169443 | Fe i | 1.6179391 | Fe i | 1.6184003 | Fe i |
| 1.6185325 | Fe i | 1.6190221 | Fe i | 1.6199481 | Fe i | 1.6201500 | Ca i |
| 1.6202925 | Fe i | 1.6208676 | Fe i | 1.6212171 | Fe i | 1.6217965 | Fe i |
| 1.6220121 | Si i | 1.6230050 | Fe i | 1.6236082 | Fe i | 1.6240402 | Fe i |
| 1.6246289 | Si i | 1.6250896 | Fe i | 1.6289216 | Fe i | 1.6297294 | Fe i |
| 1.6314951 | Ni i | 1.6320779 | Fe i | 1.6323154 | Fe i | 1.6328914 | Fe i |
| 1.6335988 | Fe i | 1.6367558 | Ni i | 1.6384614 | Si i | 1.6385334 | Fe i |
| 1.6386023 | Si i | 1.6386729 | Fe i | 1.6388615 | Fe i | 1.6398865 | Fe i |
| 1.6402644 | Fe i | 1.6409076 | Fe i | 1.6412269 | Fe i | 1.6439419 | Si i |
| 1.6441112 | Fe i | 1.6444888 | Fe i | 1.6449307 | Fe i | 1.6459396 | Fe i |
| 1.6471419 | Fe i | 1.6478580 | Fe i | 1.6491168 | Fe i | 1.6510801 | Fe i |
| 1.6521735 | Fe i | 1.6526587 | Fe i | 1.6528981 | Fe i | 1.6536499 | Fe i |
| 1.6543711 | Fe i | 1.6545939 | Fe i | 1.6556516 | Fe i | 1.6566292 | Fe i |
| 1.6617302 | Fe i | 1.6650419 | Fe i | 1.6658076 | Fe i | 1.6664068 | Fe i |
| 1.6665922 | Fe i | 1.6670032 | Fe i | 1.6685326 | Si i | 1.6723540 | Al i |
| 1.6727843 | Fe i | 1.6755176 | Al i | 1.6757642 | Fe i | 1.6767949 | Al i |
| 1.6804235 | Fe i | 1.6825109 | Fe i | 1.6832772 | Si i | 1.6871891 | Ni i |
| 1.6894975 | C i | 1.6974543 | Fe i | 1.7000887 | Ni i | 1.7005669 | Ni i |
| 1.7010089 | Fe i | 1.7015741 | Fe i | 1.7072339 | Fe i | 1.7113303 | Mg i |
| 1.7165793 | Fe i | 1.7208997 | Fe i | 1.7210463 | Si i | 1.7230331 | Si i |
| 1.7307038 | Fe i | 1.7332059 | Si i | 1.7343286 | C i | 1.7412291 | Mg i |
| 1.7414241 | Fe i | 1.7471683 | Si i | 1.7553341 | Fe i | 1.7585284 | Fe i |
| 1.7613504 | Fe i | 1.7621891 | Si i | 1.7628162 | Si i | 1.7688737 | Fe i |
| 1.7711463 | Fe i | 1.7725933 | Fe i | 1.7726210 | Fe i | 1.7732942 | Fe i |
| 1.7758583 | Mg i | 1.7766912 | Mg i | 1.7775974 | Fe i | 1.7840949 | Fe i |
| 1.7850865 | Fe i | 1.7890004 | Fe i | 1.7935075 | Fe i | 1.7942698 | Fe i |
| 1.7943777 | Fe i | 1.7971303 | Fe i | 1.7984291 | Fe i | 1.7987210 | Fe i |
| 1.7991446 | Ni i | 1.8006762 | Cr i | 1.8045770 | Ni i | 1.8078612 | Fe i |
| 1.8101228 | Fe i | 1.8194902 | Fe i | 1.9430568 | Mg i | 1.9458301 | Ca i |
| 1.9489667 | Fe i | 1.9496166 | Fe i | 1.9498705 | Si i | 1.9511040 | Ca i |
| 1.9511446 | Si i | 1.9513500 | Si i | 1.9514636 | Fe i | 1.9598082 | Fe i |
| 1.9616920 | Fe i | 1.9618503 | Fe i | 1.9640681 | Fe i | 1.9723943 | V i |
| 1.9727936 | Si i | 1.9728928 | Mg i | 1.9739257 | Mg i | 1.9782195 | Ca i |
| 1.9797279 | Fe i | 1.9820428 | Ca i | 1.9852129 | Fe i | 1.9858512 | Ca i |
| 1.9867646 | Ca i | 1.9922628 | Ca i | 1.9928778 | Fe i | 1.9934361 | Si i |
| 1.9939170 | Ca i | 1.9967282 | Ca i | 2.0097535 | Fe i | 2.0286617 | Fe i |
| 2.0301933 | Si i | 2.0349441 | Si i | 2.0355272 | Fe i | 2.0383973 | Si i |
| 2.0569580 | Fe i | 2.0608501 | Si i | 2.0635321 | Fe i | 2.0703959 | Fe i |
| 2.0704272 | Si i | 2.0722606 | Fe i | 2.0809875 | Si i | 2.0810766 | Fe i |
| 2.0846491 | Fe i | 2.0922821 | Si i | 2.1065505 | Mg i | 2.1066642 | Mg i |
| 2.1098835 | Al i | 2.1169577 | Al i | 2.1244261 | Fe i | 2.1360087 | Si i |
| 2.1785696 | Si i | 2.1788888 | Ti i | 2.1825655 | Si i | 2.1885319 | Si i |
| 2.1903353 | Ti i | 2.2010505 | Ti i | 2.2057965 | Sc i | 2.2062447 | Na i |
| 2.2068751 | Si i | 2.2089689 | Na i | 2.2217295 | Ti i | 2.2238901 | Ti i |
| 2.2263176 | Fe i | 2.2266250 | Fe i | 2.2280107 | Ti i | 2.2316670 | Ti i |
| 2.2386901 | Fe i | 2.2398975 | Fe i | 2.2450020 | Ti i | 2.2479405 | Fe i |
| 2.2543838 | Si i | 2.2614114 | Ca i | 2.2626002 | Fe i | 2.2631137 | Ca i |
| 2.2632897 | Ca i | 2.2657359 | Ca i | 2.2671964 | Si i | 2.2814252 | Mg i |
| 2.2969596 | Ti i | 2.3150909 | Fe i | 2.3354795 | Na i | 2.3385518 | Na i |
| 2.3447857 | Ti i | 2.4572999 | Mg i | 2.4825687 | Mg i | 2.4867327 | Mg i |
| 3.0277195 | Mg i | 3.1517396 | Si i | 3.3970842 | Mg i | 3.6771872 | Mg i |
| 3.6789458 | Mg i | 3.6825631 | Mg i | 3.7091205 | Fe i | 3.8632832 | Al i |
| 3.8664858 | Mg i | 3.8669012 | Mg i | 3.8721194 | Al i |
Table 8. EW Limit Definitions
| Feature | Feature Limits (μm) | First Continuum Level Limits (μm) | Second Continuum Level Limits (μm) |
|---|---|---|---|
| Ca ii (0.866 μm) | 0.860–0.875 | 0.862–0.864 | 0.870–0.873 |
| Na i (1.14 μm) | 1.120–1.160 | 1.125–1.130 | 1.150–1.160 |
| Al i (1.313 μm) | 1.300–1.330 | 1.305–1.309 | 1.320–1.325 |
| Mg i (1.485 μm) | 1.475–1.4975 | 1.4775–1.485 | 1.491–1.497 |
| Mg i (1.711 μm) | 1.695–1.726 | 1.702–1.708 | 1.715–1.720 |
| Na i (2.206 μm) | 2.185–2.230 | 2.192–2.198 | 2.213–2.220 |
Download table as: ASCIITypeset image
Table 9. EWs
| Object | Spectral Type | Ca ii (0.866 μm) | Na i (1.14 μm) | Al i (1.313 μm) | Mg i (1.485 μm) | Mg i (1.711 μm) | Na i (2.206 μm) |
|---|---|---|---|---|---|---|---|
| HD 7927 | F0 Ia | 3.73 ± 0.12 | 0.13 ± 0.36 | 0.32 ± 0.03 | 0.59 ± 0.18 | 0.03 ± 0.03 | −0.12 ± 0.04 |
| HD 135153 | F0 Ib−II | 4.38 ± 0.07 | 0.45 ± 0.41 | 0.48 ± 0.12 | 0.60 ± 0.28 | 0.20 ± 0.05 | 0.28 ± 0.10 |
| HD 6130 | F0 II | 4.06 ± 0.08 | 0.66 ± 0.25 | 0.49 ± 0.05 | 0.53 ± 0.10 | 0.20 ± 0.04 | 0.31 ± 0.05 |
| HD 89025 | F0 IIIa | 3.28 ± 0.03 | 1.01 ± 0.14 | 0.38 ± 0.03 | 0.48 ± 0.07 | 0.24 ± 0.04 | 0.27 ± 0.03 |
| HD 13174 | F0 III−IVn | 3.05 ± 0.04 | 0.99 ± 0.17 | 0.61 ± 0.05 | 0.62 ± 0.12 | 0.37 ± 0.03 | 0.50 ± 0.04 |
| HD 27397 | F0 IV | 2.76 ± 0.04 | 0.45 ± 0.23 | 0.41 ± 0.05 | 0.63 ± 0.09 | 0.32 ± 0.03 | 0.50 ± 0.05 |
| HD 108519 | F0 V(n) | 2.56 ± 0.03 | 0.58 ± 0.17 | 0.37 ± 0.03 | 0.52 ± 0.06 | 0.31 ± 0.03 | 0.41 ± 0.04 |
| HD 173638 | F1 II | 4.48 ± 0.09 | 0.57 ± 0.30 | 0.46 ± 0.03 | 0.41 ± 0.08 | 0.15 ± 0.05 | 0.09 ± 0.06 |
| HD 213135 | F1 V | 2.07 ± 0.03 | 0.49 ± 0.17 | 0.41 ± 0.04 | 0.74 ± 0.08 | 0.50 ± 0.04 | 0.65 ± 0.05 |
| BD +38 2803 | F2−F5 Ib | 2.04 ± 0.03 | 0.21 ± 0.16 | 0.14 ± 0.05 | 0.62 ± 0.16 | 0.26 ± 0.03 | −0.02 ± 0.03 |
| HD 182835 | F2 Ib | 4.74 ± 0.10 | 0.28 ± 0.36 | 0.57 ± 0.04 | 0.46 ± 0.09 | 0.21 ± 0.05 | 0.32 ± 0.06 |
| HD 40535 | F2 III−IV | 2.80 ± 0.03 | 0.73 ± 0.16 | 0.46 ± 0.02 | 0.53 ± 0.06 | 0.34 ± 0.03 | 0.43 ± 0.05 |
| HD 164136 | kA9hF2mF2 (IV) | 2.62 ± 0.04 | 0.92 ± 0.13 | 0.42 ± 0.04 | 0.52 ± 0.09 | 0.31 ± 0.05 | 0.35 ± 0.05 |
| HD 113139 | F2 V | 2.19 ± 0.04 | 1.00 ± 0.13 | 0.44 ± 0.05 | 0.62 ± 0.10 | 0.41 ± 0.03 | 0.44 ± 0.03 |
| HD 26015 | F3 V | 2.38 ± 0.04 | 0.70 ± 0.17 | 0.53 ± 0.02 | 0.83 ± 0.06 | 0.40 ± 0.04 | 0.64 ± 0.05 |
| HD 21770 | F4 III | 2.04 ± 0.03 | 0.41 ± 0.14 | 0.35 ± 0.03 | 0.60 ± 0.04 | 0.33 ± 0.03 | 0.39 ± 0.05 |
| HD 87822 | F4 V | 2.27 ± 0.04 | 0.51 ± 0.18 | 0.55 ± 0.02 | 0.95 ± 0.06 | 0.48 ± 0.04 | 0.61 ± 0.04 |
| HD 16232 | F4 V | 1.92 ± 0.06 | 0.41 ± 0.25 | 0.81 ± 0.05 | 1.26 ± 0.10 | 0.80 ± 0.06 | 1.09 ± 0.04 |
| HD 213306 | F5 Ib − G1 Ib | 4.42 ± 0.08 | 1.40 ± 0.37 | 1.09 ± 0.13 | 0.77 ± 0.48 | 0.49 ± 0.08 | 0.96 ± 0.08 |
| HD 186155 | F5 II−III | 2.99 ± 0.07 | 0.63 ± 0.31 | 0.75 ± 0.06 | 0.93 ± 0.09 | 0.46 ± 0.05 | 0.58 ± 0.06 |
| HD 17918 | F5 III | 2.69 ± 0.05 | 0.81 ± 0.14 | 0.64 ± 0.02 | 0.71 ± 0.05 | 0.37 ± 0.03 | 0.59 ± 0.04 |
| HD 218804 | F5 V | 1.98 ± 0.04 | 1.16 ± 0.17 | 0.61 ± 0.08 | 0.86 ± 0.15 | 0.75 ± 0.04 | 0.91 ± 0.04 |
| HD 27524 | F5 V | 2.12 ± 0.05 | 0.69 ± 0.18 | 0.64 ± 0.03 | 1.03 ± 0.07 | 0.54 ± 0.05 | 0.75 ± 0.05 |
| HD 75555 | F5.5 III−IV | 2.57 ± 0.05 | 0.82 ± 0.20 | 0.58 ± 0.04 | 0.87 ± 0.08 | 0.47 ± 0.04 | 0.62 ± 0.08 |
| HD 160365 | F6 III−IV | 2.49 ± 0.05 | 0.57 ± 0.16 | 0.62 ± 0.02 | 0.76 ± 0.07 | 0.44 ± 0.05 | 0.83 ± 0.04 |
| HD 11443 | F6 IV | 2.24 ± 0.05 | 0.61 ± 0.17 | 0.57 ± 0.03 | 0.83 ± 0.06 | 0.46 ± 0.04 | 0.67 ± 0.05 |
| HD 215648 | F6 V | 2.05 ± 0.03 | 0.65 ± 0.19 | 0.32 ± 0.07 | 0.26 ± 0.13 | 0.24 ± 0.04 | 0.28 ± 0.06 |
| HD 201078 | F7 II– | 3.64 ± 0.06 | 1.17 ± 0.23 | 0.74 ± 0.06 | 0.71 ± 0.13 | 0.39 ± 0.05 | 0.65 ± 0.10 |
| HD 124850 | F7 III | 2.16 ± 0.05 | 0.38 ± 0.22 | 0.58 ± 0.03 | 0.96 ± 0.06 | 0.52 ± 0.04 | 0.60 ± 0.06 |
| HD 126660 | F7 V | 2.00 ± 0.05 | 0.78 ± 0.16 | 0.59 ± 0.03 | 1.09 ± 0.08 | 0.61 ± 0.05 | 0.67 ± 0.05 |
| HD 190323 | F8 Ia | 5.27 ± 0.11 | 1.04 ± 0.40 | 1.11 ± 0.03 | 0.99 ± 0.14 | 0.35 ± 0.08 | 0.68 ± 0.09 |
| HD 51956 | F8 Ib | 3.61 ± 0.09 | 1.08 ± 0.29 | 1.07 ± 0.03 | 0.98 ± 0.12 | 0.53 ± 0.08 | 1.10 ± 0.05 |
| HD 220657 | F8 III | 2.52 ± 0.06 | 1.01 ± 0.24 | 0.66 ± 0.08 | 0.73 ± 0.14 | 0.41 ± 0.06 | 0.55 ± 0.05 |
| HD 111844 | F8 IV | 2.27 ± 0.03 | 0.57 ± 0.20 | 0.45 ± 0.04 | 0.61 ± 0.06 | 0.28 ± 0.02 | 0.39 ± 0.05 |
| HD 219623 | F8 V | 2.35 ± 0.05 | 0.61 ± 0.32 | 0.89 ± 0.07 | 1.22 ± 0.14 | 0.79 ± 0.06 | 0.84 ± 0.04 |
| HD 27383 | F8 V | 2.31 ± 0.05 | 0.58 ± 0.24 | 0.91 ± 0.04 | 1.44 ± 0.10 | 0.94 ± 0.07 | 1.04 ± 0.04 |
| HD 102870 | F8.5 IV−V | 2.31 ± 0.07 | 0.54 ± 0.27 | 0.83 ± 0.04 | 1.24 ± 0.10 | 0.73 ± 0.06 | 0.93 ± 0.04 |
| HD 6903 | F9 IIIa | 2.68 ± 0.06 | 0.88 ± 0.21 | 0.79 ± 0.04 | 0.89 ± 0.09 | 0.42 ± 0.06 | 0.68 ± 0.04 |
| HD 176051 | F9 V | 2.08 ± 0.07 | 0.84 ± 0.17 | 0.99 ± 0.04 | 1.55 ± 0.11 | 1.22 ± 0.06 | 0.96 ± 0.06 |
| HD 165908 | F9 V metal weak | 1.79 ± 0.05 | 0.29 ± 0.24 | 0.42 ± 0.09 | 0.92 ± 0.26 | 0.61 ± 0.06 | 0.49 ± 0.08 |
| HD 114710 | F9.5 V | 2.33 ± 0.05 | 0.45 ± 0.25 | 0.89 ± 0.04 | 1.40 ± 0.13 | 0.90 ± 0.06 | 0.96 ± 0.06 |
| HD 185018 | G0 Ib−II | 3.38 ± 0.08 | 0.49 ± 0.33 | 0.94 ± 0.06 | 0.89 ± 0.12 | 0.52 ± 0.09 | 0.93 ± 0.06 |
| HD 109358 | G0 V | 1.97 ± 0.06 | 0.23 ± 0.17 | 0.79 ± 0.03 | 1.24 ± 0.08 | 0.88 ± 0.05 | 0.90 ± 0.03 |
| HD 74395 | G1 Ib | 3.82 ± 0.09 | 0.70 ± 0.37 | 1.14 ± 0.05 | 1.05 ± 0.13 | 0.55 ± 0.12 | 1.19 ± 0.04 |
| HD 216219 | G1 II−III: Fe−1 CH0.5 | 2.17 ± 0.05 | 0.81 ± 0.20 | 0.50 ± 0.05 | 0.81 ± 0.10 | 0.33 ± 0.05 | 0.42 ± 0.07 |
| HD 21018 | G1 III: CH−1: | 2.99 ± 0.09 | 1.00 ± 0.28 | 0.99 ± 0.05 | 1.07 ± 0.11 | 0.58 ± 0.11 | 1.11 ± 0.03 |
| HD 10307 | G1 V | 2.06 ± 0.07 | 0.39 ± 0.22 | 0.88 ± 0.08 | 1.38 ± 0.16 | 0.95 ± 0.06 | 1.11 ± 0.04 |
| HD 95128 | G1− V Fe−0.5 | 2.25 ± 0.05 | 0.27 ± 0.23 | 0.87 ± 0.03 | 1.45 ± 0.09 | 0.93 ± 0.06 | 1.06 ± 0.03 |
| HD 20619 | G1.5 V | 1.96 ± 0.06 | −0.03 ± 0.22 | 0.90 ± 0.03 | 1.59 ± 0.09 | 1.15 ± 0.05 | 1.00 ± 0.06 |
| HD 42454 | G2 Ib | 4.19 ± 0.10 | 1.38 ± 0.41 | 1.10 ± 0.09 | 0.94 ± 0.17 | 0.57 ± 0.11 | 1.21 ± 0.05 |
| HD 39949 | G2 Ib | 3.51 ± 0.09 | 1.17 ± 0.38 | 0.95 ± 0.09 | 0.96 ± 0.18 | 0.53 ± 0.11 | 1.14 ± 0.05 |
| HD 3421 | G2 Ib−II | 3.13 ± 0.07 | 0.76 ± 0.26 | 0.91 ± 0.06 | 0.88 ± 0.13 | 0.52 ± 0.09 | 0.74 ± 0.06 |
| HD 219477 | G2 II−III | 2.95 ± 0.06 | 0.75 ± 0.24 | 0.82 ± 0.07 | 0.76 ± 0.10 | 0.40 ± 0.09 | 0.80 ± 0.05 |
| HD 126868 | G2 IV | 2.27 ± 0.07 | 0.61 ± 0.24 | 0.88 ± 0.06 | 1.22 ± 0.15 | 0.79 ± 0.08 | 0.96 ± 0.07 |
| HD 76151 | G2 V | 2.18 ± 0.08 | 0.83 ± 0.23 | 1.15 ± 0.04 | 1.81 ± 0.14 | 1.20 ± 0.10 | 1.31 ± 0.04 |
| HD 192713 | G3 Ib−II Wk H&K comp? | 3.94 ± 0.12 | 1.23 ± 0.44 | 1.24 ± 0.08 | 1.22 ± 0.21 | 0.52 ± 0.18 | 1.39 ± 0.07 |
| HD 176123 | G3 II | 3.16 ± 0.08 | 0.98 ± 0.25 | 0.99 ± 0.05 | 1.03 ± 0.13 | 0.54 ± 0.11 | 0.96 ± 0.04 |
| HD 88639 | G3 IIIb Fe−1 | 2.36 ± 0.07 | 0.32 ± 0.25 | 0.85 ± 0.04 | 0.98 ± 0.10 | 0.69 ± 0.09 | 0.93 ± 0.03 |
| HD 10697 | G3 Va | 2.32 ± 0.09 | 1.30 ± 0.26 | 1.06 ± 0.06 | 1.45 ± 0.14 | 0.97 ± 0.08 | 1.08 ± 0.05 |
| HD 179821 | G4 O−Ia | 3.44 ± 0.25 | 0.79 ± 0.47 | 0.66 ± 0.05 | 0.83 ± 0.20 | −0.44 ± 0.07 | −1.75 ± 0.08 |
| HD 6474 | G4 Ia ± 4.55 | 0.10 ± 1.63 | 0.35 ± 1.09 | 0.07 ± 0.93 | 0.18 ± 0.25 | 0.07 ± 0.23 | 0.08 |
| HD 94481 | G4 III−IIIb | 2.69 ± 0.07 | 0.93 ± 0.22 | 0.87 ± 0.04 | 1.09 ± 0.13 | 0.65 ± 0.09 | 0.98 ± 0.04 |
| HD 108477 | G4 III | 2.91 ± 0.09 | 0.63 ± 0.30 | 0.96 ± 0.04 | 0.99 ± 0.14 | 0.59 ± 0.11 | 1.10 ± 0.05 |
| HD 214850 | G4 V | 2.25 ± 0.06 | 0.71 ± 0.19 | 0.83 ± 0.05 | 1.26 ± 0.11 | 0.87 ± 0.07 | 0.95 ± 0.03 |
| HD 190113 | G5 Ib | 3.61 ± 0.12 | 1.16 ± 0.52 | 1.13 ± 0.09 | 1.17 ± 0.24 | 0.67 ± 0.20 | 1.62 ± 0.06 |
| HD 18474 | G5: III: CN−3 CH−2 Hδ − 1 | 2.65 ± 0.08 | 0.45 ± 0.27 | 0.92 ± 0.05 | 1.00 ± 0.09 | 0.68 ± 0.10 | 1.05 ± 0.05 |
| HD 193896 | G5 IIIa | 2.76 ± 0.07 | 0.76 ± 0.29 | 0.93 ± 0.05 | 1.02 ± 0.12 | 0.63 ± 0.10 | 1.10 ± 0.04 |
| HD 165185 | G5 V | 2.00 ± 0.07 | 0.64 ± 0.23 | 0.91 ± 0.06 | 1.37 ± 0.15 | 0.99 ± 0.06 | 0.93 ± 0.05 |
| HD 161664 | G6 Ib Hδ1 | 3.77 ± 0.14 | 1.47 ± 0.51 | 1.21 ± 0.12 | 0.90 ± 0.32 | 0.48 ± 0.17 | 1.40 ± 0.07 |
| HD 202314 | G6 Ib−IIa Ca1 Ba0.5 | 3.45 ± 0.11 | 0.61 ± 0.39 | 1.03 ± 0.07 | 0.87 ± 0.16 | 0.57 ± 0.16 | 1.23 ± 0.08 |
| HD 58367 | G6 IIb | 3.24 ± 0.10 | 0.95 ± 0.35 | 1.09 ± 0.07 | 1.14 ± 0.17 | 0.60 ± 0.14 | 1.13 ± 0.05 |
| HD 27277 | G6 III | 2.61 ± 0.07 | 0.44 ± 0.33 | 0.99 ± 0.05 | 1.13 ± 0.12 | 0.80 ± 0.11 | 1.14 ± 0.05 |
| HD 115617 | G6.5 V | 2.25 ± 0.06 | 0.53 ± 0.19 | 1.28 ± 0.05 | 1.81 ± 0.10 | 1.37 ± 0.08 | 1.27 ± 0.04 |
| HD 333385 | G7 Ia | 5.54 ± 0.15 | 1.70 ± 0.42 | 1.51 ± 0.07 | 1.19 ± 0.16 | −0.09 ± 0.12 | −2.05 ± 0.13 |
| HD 25877 | G7 II | 3.31 ± 0.09 | 0.93 ± 0.42 | 1.02 ± 0.08 | 1.08 ± 0.19 | 0.59 ± 0.15 | 1.28 ± 0.07 |
| HD 182694 | G7 IIIa | 2.67 ± 0.09 | 0.97 ± 0.34 | 0.97 ± 0.07 | 1.14 ± 0.19 | 0.79 ± 0.13 | 1.18 ± 0.05 |
| HD 20618 | G7 IV | 2.27 ± 0.08 | 0.66 ± 0.24 | 0.95 ± 0.06 | 1.18 ± 0.12 | 0.93 ± 0.09 | 1.12 ± 0.02 |
| HD 114946 | G7 IV | 1.96 ± 0.07 | 0.51 ± 0.20 | 0.91 ± 0.03 | 1.25 ± 0.11 | 1.01 ± 0.09 | 1.05 ± 0.04 |
| HD 16139 | G7.5 IIIa | 2.42 ± 0.09 | 0.63 ± 0.31 | 0.90 ± 0.06 | 1.12 ± 0.13 | 0.74 ± 0.11 | 1.08 ± 0.04 |
| HD 208606 | G8 Ib | 4.71 ± 0.17 | 1.72 ± 0.69 | 1.37 ± 0.16 | 1.27 ± 0.38 | 0.58 ± 0.26 | 1.91 ± 0.15 |
| HD 122563 | G8: III: Fe−5 | 0.84 ± 0.04 | 0.18 ± 0.17 | 0.07 ± 0.08 | 0.26 ± 0.18 | 0.26 ± 0.02 | −0.01 ± 0.03 |
| HD 104979 | G8 III Ba1 CN0.5 CH1 | 2.34 ± 0.07 | 0.72 ± 0.37 | 0.85 ± 0.12 | 1.21 ± 0.20 | 0.76 ± 0.12 | 0.97 ± 0.08 |
| HD 135722 | G8 III Fe−1 | 2.33 ± 0.07 | 0.80 ± 0.21 | 0.95 ± 0.07 | 1.15 ± 0.13 | 0.79 ± 0.11 | 0.98 ± 0.06 |
| HD 101501 | G8 V | 2.27 ± 0.06 | 0.64 ± 0.22 | 1.25 ± 0.05 | 1.88 ± 0.14 | 1.42 ± 0.09 | 1.34 ± 0.04 |
| HD 75732 | G8 V | 2.37 ± 0.10 | 0.90 ± 0.37 | 1.87 ± 0.06 | 2.16 ± 0.17 | 2.05 ± 0.15 | 2.32 ± 0.05 |
| HD 170820 | G9 II CN1 Hδ1 | 3.71 ± 0.13 | 0.78 ± 0.60 | 1.03 ± 0.15 | 0.98 ± 0.28 | 0.45 ± 0.26 | 1.42 ± 0.16 |
| HD 222093 | G9 III | 2.52 ± 0.09 | 0.88 ± 0.29 | 1.04 ± 0.07 | 1.17 ± 0.16 | 0.87 ± 0.14 | 1.09 ± 0.04 |
| HD 165782 | K0 Ia | 5.69 ± 0.13 | 1.72 ± 0.54 | 1.38 ± 0.06 | 0.85 ± 0.17 | −0.12 ± 0.09 | −0.75 ± 0.12 |
| HD 44391 | K0 Ib | 3.76 ± 0.14 | 1.44 ± 0.47 | 1.10 ± 0.10 | 1.28 ± 0.25 | 0.68 ± 0.22 | 1.66 ± 0.09 |
| HD 179870 | K0 II | 3.06 ± 0.12 | 1.49 ± 0.42 | 1.01 ± 0.12 | 1.32 ± 0.26 | 0.74 ± 0.18 | 1.34 ± 0.07 |
| HD 100006 | K0 III | 2.53 ± 0.10 | 0.67 ± 0.32 | 1.01 ± 0.06 | 1.18 ± 0.14 | 0.74 ± 0.15 | 1.16 ± 0.07 |
| HD 145675 | K0 V | 2.19 ± 0.13 | 1.28 ± 0.33 | 1.88 ± 0.07 | 2.76 ± 0.20 | 2.07 ± 0.16 | 2.60 ± 0.05 |
| HD 164349 | K0.5 IIb | 3.05 ± 0.12 | 1.66 ± 0.41 | 1.04 ± 0.12 | 1.28 ± 0.24 | 0.74 ± 0.21 | 1.41 ± 0.10 |
| HD 9852 | K0.5 III CN1 | 3.09 ± 0.14 | 1.17 ± 0.43 | 1.08 ± 0.12 | 1.37 ± 0.26 | 0.79 ± 0.23 | 1.69 ± 0.10 |
| HD 63302 | K1 Ia−Iab | 4.74 ± 0.18 | 1.91 ± 0.82 | 1.49 ± 0.20 | 1.72 ± 0.40 | 1.01 ± 0.44 | 2.78 ± 0.26 |
| HD 36134 | K1− III Fe−0.5 | 2.58 ± 0.10 | 0.75 ± 0.29 | 1.08 ± 0.07 | 1.26 ± 0.17 | 1.03 ± 0.17 | 1.35 ± 0.06 |
| HD 91810 | K1− IIIb CN1.5 Ca1 | 2.98 ± 0.13 | 0.65 ± 0.45 | 1.28 ± 0.11 | 1.35 ± 0.22 | 1.08 ± 0.23 | 1.87 ± 0.10 |
| HD 25975 | K1 III | 2.30 ± 0.09 | 0.90 ± 0.27 | 1.24 ± 0.06 | 1.68 ± 0.14 | 1.29 ± 0.13 | 1.33 ± 0.04 |
| HD 165438 | K1 IV | 2.30 ± 0.10 | 1.03 ± 0.32 | 1.27 ± 0.08 | 1.54 ± 0.18 | 1.40 ± 0.14 | 1.52 ± 0.05 |
| HD 142091 | K1 IVa | 2.38 ± 0.10 | 0.81 ± 0.38 | 1.33 ± 0.09 | 1.58 ± 0.20 | 1.35 ± 0.16 | 1.57 ± 0.07 |
| HD 10476 | K1 V | 2.22 ± 0.09 | 1.25 ± 0.21 | 1.50 ± 0.05 | 2.14 ± 0.16 | 1.82 ± 0.10 | 1.54 ± 0.04 |
| HD 212466 | K2 O−Ia | 6.13 ± 0.22 | 3.22 ± 1.05 | 1.81 ± 0.17 | 1.88 ± 0.42 | 0.53 ± 0.27 | 1.29 ± 0.14 |
| HD 2901 | K2 III Fe−1 | 2.40 ± 0.06 | 0.68 ± 0.25 | 1.00 ± 0.07 | 1.17 ± 0.15 | 1.32 ± 0.20 | 1.54 ± 0.04 |
| HD 132935 | K2 III | 2.77 ± 0.08 | 0.55 ± 0.32 | 1.08 ± 0.09 | 1.11 ± 0.17 | 1.14 ± 0.21 | 1.45 ± 0.06 |
| HD 137759 | K2 III | 2.60 ± 0.11 | 1.36 ± 0.33 | 1.23 ± 0.09 | 1.60 ± 0.20 | 1.21 ± 0.20 | 1.79 ± 0.09 |
| HD 3765 | K2 V | 2.22 ± 0.10 | 1.66 ± 0.30 | 2.05 ± 0.07 | 2.71 ± 0.22 | 2.44 ± 0.15 | 2.17 ± 0.05 |
| HD 23082 | K2.5 II | 3.56 ± 0.15 | 1.73 ± 0.54 | 1.16 ± 0.18 | 1.56 ± 0.32 | 1.20 ± 0.40 | 2.61 ± 0.20 |
| HD 187238 | K3 Iab−Ib | 4.02 ± 0.16 | 2.06 ± 0.66 | 1.45 ± 0.20 | 1.61 ± 0.34 | 1.23 ± 0.45 | 3.09 ± 0.25 |
| HD 16068 | K3 II−III | 3.34 ± 0.13 | 1.36 ± 0.54 | 1.05 ± 0.19 | 1.50 ± 0.32 | 1.12 ± 0.35 | 2.43 ± 0.16 |
| HD 221246 | K3 III | 3.33 ± 0.13 | 1.34 ± 0.39 | 1.26 ± 0.13 | 1.39 ± 0.22 | 1.23 ± 0.32 | 2.26 ± 0.13 |
| HD 178208 | K3 III | 2.87 ± 0.12 | 1.62 ± 0.42 | 1.38 ± 0.14 | 1.77 ± 0.26 | 1.36 ± 0.31 | 2.42 ± 0.12 |
| HD 35620 | K3 III Fe1 | 2.98 ± 0.14 | 1.09 ± 0.56 | 1.12 ± 0.16 | 1.36 ± 0.30 | 1.35 ± 0.35 | 2.38 ± 0.16 |
| HD 99998 | K3+ III Fe−0.5 | 2.83 ± 0.11 | 0.75 ± 0.36 | 1.00 ± 0.12 | 1.46 ± 0.21 | 1.61 ± 0.34 | 2.16 ± 0.07 |
| HD 114960 | K3.5 IIIb CN0.5 CH0.5 | 2.93 ± 0.14 | 1.35 ± 0.39 | 1.43 ± 0.15 | 1.76 ± 0.25 | 1.47 ± 0.37 | 2.77 ± 0.15 |
| HD 219134 | K3 V | 2.44 ± 0.09 | 1.29 ± 0.46 | 2.19 ± 0.08 | 2.86 ± 0.19 | 2.79 ± 0.14 | 2.73 ± 0.04 |
| HD 185622 | K4 Ib | 4.30 ± 0.17 | 2.37 ± 0.61 | 1.50 ± 0.23 | 1.78 ± 0.34 | 1.55 ± 0.56 | 3.74 ± 0.30 |
| HD 201065 | K4 Ib−II | 3.61 ± 0.15 | 1.87 ± 0.46 | 1.15 ± 0.17 | 1.61 ± 0.30 | 1.32 ± 0.42 | 2.79 ± 0.17 |
| HD 207991 | K4− III | 2.83 ± 0.12 | 0.59 ± 0.40 | 1.11 ± 0.14 | 1.14 ± 0.20 | 1.64 ± 0.34 | 2.18 ± 0.07 |
| HD 45977 | K4 V | 2.28 ± 0.09 | 1.06 ± 0.40 | 2.80 ± 0.07 | 2.95 ± 0.20 | 3.21 ± 0.19 | 3.49 ± 0.05 |
| HD 216946 | K5 Ib | 3.84 ± 0.14 | 1.95 ± 0.47 | 1.19 ± 0.21 | 1.96 ± 0.32 | 1.76 ± 0.52 | 3.49 ± 0.21 |
| HD 181596 | K5 III | 3.31 ± 0.09 | 1.76 ± 0.30 | 1.02 ± 0.15 | 1.44 ± 0.24 | 1.81 ± 0.42 | 2.74 ± 0.09 |
| HD 36003 | K5 V | 2.19 ± 0.09 | 1.51 ± 0.26 | 2.86 ± 0.06 | 3.08 ± 0.16 | 3.47 ± 0.15 | 3.03 ± 0.04 |
| HD 120477 | K5.5 III | 2.89 ± 0.10 | 1.21 ± 0.35 | 1.39 ± 0.14 | 1.63 ± 0.22 | 1.90 ± 0.44 | 2.79 ± 0.12 |
| HD 3346 | K6 IIIa | 2.89 ± 0.09 | 1.04 ± 0.37 | 1.01 ± 0.13 | 1.49 ± 0.21 | 1.99 ± 0.42 | 2.59 ± 0.09 |
| HD 181475 | K7 IIa | 3.97 ± 0.16 | 1.60 ± 0.57 | 1.22 ± 0.22 | 1.61 ± 0.34 | 1.69 ± 0.52 | 3.43 ± 0.21 |
| HD 194193 | K7 III | 3.05 ± 0.13 | 1.08 ± 0.31 | 1.10 ± 0.14 | 1.45 ± 0.20 | 1.95 ± 0.43 | 2.60 ± 0.09 |
| HD 237903 | K7 V | 2.13 ± 0.08 | 1.88 ± 0.21 | 2.83 ± 0.06 | 2.70 ± 0.15 | 3.65 ± 0.16 | 3.69 ± 0.02 |
| HD 201092 | K7 V | 1.71 ± 0.06 | 2.66 ± 0.38 | 2.68 ± 0.15 | 2.36 ± 0.28 | 3.72 ± 0.15 | 3.43 ± 0.07 |
| HD 213893 | M0 IIIb | 2.81 ± 0.08 | 1.13 ± 0.29 | 1.25 ± 0.12 | 1.63 ± 0.17 | 2.05 ± 0.41 | 2.40 ± 0.06 |
| HD 19305 | M0 V | 2.17 ± 0.08 | 2.19 ± 0.23 | 3.09 ± 0.08 | 2.62 ± 0.15 | 3.76 ± 0.17 | 4.18 ± 0.04 |
| HD 236697 | M0.5 Ib | 3.93 ± 0.16 | 2.07 ± 0.56 | 1.18 ± 0.23 | 1.75 ± 0.36 | 2.13 ± 0.63 | 3.74 ± 0.22 |
| HD 209290 | M0.5 V | 1.61 ± 0.08 | 2.01 ± 0.27 | 2.87 ± 0.07 | 2.04 ± 0.14 | 3.54 ± 0.17 | 4.88 ± 0.03 |
| HD 339034 | M1 Ia | 5.22 ± 0.28 | 3.73 ± 1.00 | 1.70 ± 0.32 | 2.03 ± 0.55 | 0.83 ± 0.56 | 3.38 ± 0.37 |
| HD 14404 | M1− Iab−Ib | 4.11 ± 0.15 | 2.04 ± 0.58 | 1.11 ± 0.22 | 1.79 ± 0.38 | 1.46 ± 0.63 | 3.52 ± 0.23 |
| HD 39801 | M1−M2 Ia−Iab | 3.94 ± 0.15 | 2.43 ± 0.64 | 1.42 ± 0.27 | 1.91 ± 0.38 | 2.04 ± 0.68 | 4.12 ± 0.28 |
| HD 204724 | M1+ III | 3.45 ± 0.12 | 1.46 ± 0.36 | 1.25 ± 0.17 | 1.24 ± 0.21 | 1.90 ± 0.47 | 3.38 ± 0.18 |
| HD 42581 | M1 V | 1.54 ± 0.06 | 2.58 ± 0.28 | 2.96 ± 0.06 | 1.73 ± 0.11 | 3.25 ± 0.17 | 5.36 ± 0.03 |
| HD 35601 | M1.5 Iab−Ib | 4.14 ± 0.18 | 3.20 ± 0.71 | 1.20 ± 0.29 | 2.00 ± 0.48 | 1.86 ± 0.64 | 3.77 ± 0.28 |
| BD +60 265 | M1.5 Ib | 4.09 ± 0.18 | 2.81 ± 0.61 | 1.18 ± 0.24 | 1.85 ± 0.35 | 1.48 ± 0.62 | 3.51 ± 0.33 |
| HD 36395 | M1.5 V | 1.60 ± 0.07 | 4.02 ± 0.23 | 3.52 ± 0.08 | 2.34 ± 0.18 | 3.89 ± 0.21 | 7.49 ± 0.06 |
| HD 206936 | M2− Ia | 4.23 ± 0.20 | 3.42 ± 1.00 | 1.67 ± 0.31 | 1.78 ± 0.62 | 1.57 ± 0.62 | 3.81 ± 0.41 |
| HD 10465 | M2 Ib | 4.03 ± 0.14 | 2.81 ± 0.55 | 1.35 ± 0.28 | 1.63 ± 0.38 | 2.40 ± 0.69 | 3.88 ± 0.22 |
| HD 23475 | M2 II | 3.62 ± 0.12 | 1.94 ± 0.55 | 1.31 ± 0.22 | 1.70 ± 0.37 | 2.37 ± 0.57 | 3.82 ± 0.22 |
| HD 120052 | M2 III | 2.85 ± 0.09 | 0.85 ± 0.40 | 1.11 ± 0.14 | 1.83 ± 0.26 | 2.42 ± 0.44 | 2.49 ± 0.07 |
| HD 95735 | M2 V | 1.43 ± 0.04 | 2.23 ± 0.28 | 2.36 ± 0.07 | 1.19 ± 0.16 | 2.13 ± 0.16 | 3.00 ± 0.09 |
| Gl 806 | M2 V | 1.25 ± 0.08 | 3.01 ± 0.26 | 2.39 ± 0.07 | 1.02 ± 0.12 | 2.18 ± 0.17 | 4.11 ± 0.09 |
| HD 219734 | M2.5 III Ba0.5 | 3.19 ± 0.12 | 1.27 ± 0.40 | 1.29 ± 0.17 | 1.73 ± 0.28 | 2.33 ± 0.51 | 3.20 ± 0.12 |
| Gl 381 | M2.5 V | 1.11 ± 0.07 | 3.10 ± 0.21 | 2.48 ± 0.08 | 1.01 ± 0.16 | 1.97 ± 0.16 | 4.47 ± 0.07 |
| Gl 581 | M2.5 V | 0.98 ± 0.05 | 3.38 ± 0.19 | 2.39 ± 0.06 | 0.78 ± 0.16 | 1.56 ± 0.16 | 4.71 ± 0.09 |
| RW Cyg | M3 to M4 Ia−Iab | 3.96 ± 0.19 | 2.87 ± 0.70 | 1.45 ± 0.29 | 1.93 ± 0.42 | 1.38 ± 0.67 | 4.19 ± 0.39 |
| CD −31 4916 | M3 Iab−Ia | 3.42 ± 0.14 | 1.47 ± 0.68 | 1.05 ± 0.24 | 2.02 ± 0.41 | 2.25 ± 0.69 | 3.98 ± 0.32 |
| HD 14469 | M3−M4 Iab | 3.42 ± 0.10 | 2.26 ± 0.54 | 1.17 ± 0.26 | 2.16 ± 0.46 | 2.07 ± 0.78 | 4.25 ± 0.30 |
| HD 40239 | M3 IIb | 3.36 ± 0.10 | 2.02 ± 0.33 | 1.23 ± 0.18 | 1.64 ± 0.28 | 2.30 ± 0.60 | 3.67 ± 0.18 |
| HD 39045 | M3 III | 2.63 ± 0.10 | 1.22 ± 0.31 | 1.00 ± 0.16 | 1.86 ± 0.23 | 2.41 ± 0.53 | 3.04 ± 0.08 |
| Gl 388 | M3 V | 0.76 ± 0.08 | 4.56 ± 0.25 | 2.63 ± 0.09 | 1.09 ± 0.17 | 2.12 ± 0.20 | 5.80 ± 0.09 |
| HD 14488 | M3.5 Iab Fe−1 var? | 3.08 ± 0.10 | 2.25 ± 0.61 | 1.08 ± 0.26 | 2.04 ± 0.42 | 2.34 ± 0.77 | 4.33 ± 0.32 |
| HD 28487 | M3.5 III Ca−0.5 | 2.68 ± 0.08 | 0.46 ± 0.35 | 1.14 ± 0.16 | 1.63 ± 0.32 | 2.63 ± 0.58 | 3.05 ± 0.12 |
| Gl 273 | M3.5 V | 1.13 ± 0.05 | 3.58 ± 0.28 | 2.51 ± 0.07 | 0.71 ± 0.18 | 1.43 ± 0.17 | 4.28 ± 0.10 |
| HD 19058 | M4+ IIIa | 2.79 ± 0.09 | 0.73 ± 0.38 | 0.98 ± 0.18 | 1.82 ± 0.32 | 2.74 ± 0.61 | 3.59 ± 0.12 |
| HD 214665 | M4+ III | 2.91 ± 0.10 | 0.88 ± 0.51 | 1.44 ± 0.28 | 1.73 ± 0.44 | 2.40 ± 0.62 | 3.61 ± 0.16 |
| HD 4408 | M4 III | 3.14 ± 0.11 | 1.37 ± 0.32 | 1.14 ± 0.18 | 1.77 ± 0.28 | 2.44 ± 0.62 | 3.60 ± 0.14 |
| HD 27598 | M4− III | 2.76 ± 0.09 | 0.47 ± 0.33 | 1.04 ± 0.17 | 1.82 ± 0.27 | 2.57 ± 0.57 | 2.92 ± 0.11 |
| Gl 213 | M4 V | 0.69 ± 0.08 | 4.78 ± 0.22 | 2.52 ± 0.07 | 0.52 ± 0.17 | 1.06 ± 0.17 | 3.72 ± 0.13 |
| Gl 299 | M4 V | 0.75 ± 0.09 | 5.68 ± 0.19 | 2.66 ± 0.07 | 0.22 ± 0.20 | 0.59 ± 0.15 | 2.86 ± 0.14 |
| HD 204585 | M4.5 IIIa | 3.00 ± 0.08 | 1.64 ± 0.33 | 1.19 ± 0.24 | 1.68 ± 0.30 | 2.48 ± 0.67 | 4.26 ± 0.20 |
| Gl 268AB | M4.5 V | 0.07 ± 0.10 | 6.67 ± 0.25 | 2.21 ± 0.09 | 0.44 ± 0.18 | 0.82 ± 0.18 | 6.52 ± 0.10 |
| HD 156014 | M5 Ib−II | 2.48 ± 0.09 | 1.78 ± 0.33 | 1.21 ± 0.24 | 1.98 ± 0.37 | 2.73 ± 0.69 | 4.18 ± 0.15 |
| HD 175865 | M5 III | 2.70 ± 0.08 | 1.53 ± 0.40 | 1.14 ± 0.21 | 1.89 ± 0.29 | 2.53 ± 0.67 | 4.13 ± 0.15 |
| Gl 51 | M5 V | −0.60 ± 0.14 | 7.82 ± 0.29 | 2.73 ± 0.13 | 0.50 ± 0.29 | 0.61 ± 0.25 | 6.79 ± 0.15 |
| Gl 866ABC | M5 V | −0.54 ± 0.17 | 10.62 ± 0.28 | 2.35 ± 0.17 | 0.25 ± 0.23 | −0.02 ± 0.25 | 6.44 ± 0.15 |
| HD 94705 | M5.5 III: | 2.22 ± 0.09 | 1.18 ± 0.35 | 1.43 ± 0.20 | 1.85 ± 0.30 | 2.73 ± 0.63 | 4.33 ± 0.16 |
| HD 196610 | M6 III | 1.96 ± 0.08 | 1.65 ± 0.37 | 1.35 ± 0.22 | 1.96 ± 0.29 | 2.57 ± 0.68 | 3.67 ± 0.13 |
| HD 18191 | M6− III: | 2.31 ± 0.08 | 1.02 ± 0.40 | 1.32 ± 0.20 | 1.96 ± 0.32 | 2.82 ± 0.61 | 3.88 ± 0.19 |
| Gl 406 | M6 V | −0.86 ± 0.21 | 11.88 ± 0.25 | 2.34 ± 0.19 | −0.00 ± 0.21 | −0.25 ± 0.30 | 7.01 ± 0.17 |
| GJ 1111 | M6.5 V | −1.62 ± 0.24 | 12.22 ± 0.39 | 2.32 ± 0.22 | 0.20 ± 0.36 | −0.46 ± 0.31 | 5.06 ± 0.23 |
| HD 14386 | M5e−M9e III | 0.42 ± 0.23 | 0.78 ± 0.44 | −0.00 ± 0.25 | −0.09 ± 0.55 | 1.43 ± 0.46 | 1.39 ± 0.32 |
| HD 108849 | M7− III: | 1.46 ± 0.12 | 0.84 ± 0.34 | 1.13 ± 0.23 | 2.02 ± 0.47 | 2.82 ± 0.75 | 4.15 ± 0.19 |
| HD 207076 | M7− III: | 1.76 ± 0.13 | 1.29 ± 0.31 | 1.21 ± 0.20 | 1.92 ± 0.42 | 2.48 ± 0.65 | 3.51 ± 0.12 |
| Gl 644C | M7 V | −1.75 ± 0.27 | 12.72 ± 0.31 | 2.54 ± 0.22 | 0.24 ± 0.37 | −0.57 ± 0.34 | 4.37 ± 0.26 |
| MY Cep | M7−M7.5 I | 1.94 ± 0.13 | 2.19 ± 0.77 | 1.40 ± 0.25 | 2.37 ± 0.49 | 2.12 ± 0.77 | 4.20 ± 0.24 |
| HD 69243 | M6e−M9e III | 0.15 ± 0.26 | 1.26 ± 0.47 | 0.52 ± 0.29 | −0.47 ± 0.95 | 1.77 ± 0.71 | 2.13 ± 0.68 |
| BRI B2339 − 0447 | M7 − 8 III | 0.72 ± 0.15 | 0.88 ± 0.47 | 1.69 ± 0.15 | 1.79 ± 0.68 | 2.35 ± 0.60 | 3.02 ± 0.22 |
| IRAS 01037+1219 | M8 III | 0.54 ± 2.54 | 1.82 ± 0.68 | 0.83 ± 0.30 | −0.32 ± 0.84 | 1.37 ± 0.55 | 2.22 ± 0.26 |
| Gl 752B | M8 V | −1.45 ± 0.30 | 12.56 ± 0.38 | 2.05 ± 0.33 | 0.25 ± 0.43 | −0.62 ± 0.40 | 5.02 ± 0.28 |
| LP 412 − 31 | M8 V | −2.63 ± 0.31 | 14.84 ± 0.36 | 2.60 ± 0.29 | 0.20 ± 0.37 | −0.80 ± 0.40 | 6.88 ± 0.26 |
| IRAS 21284 − 0747 | M8 − 9 III | 0.42 ± 0.27 | 2.20 ± 0.60 | 0.78 ± 0.26 | −1.25 ± 1.06 | 1.65 ± 0.59 | 1.49 ± 0.68 |
| IRAS 14436 − 0703 | M8 − 9 III | 0.54 ± 0.36 | 4.99 ± 0.79 | 1.31 ± 0.45 | −4.24 ± 1.78 | 1.74 ± 0.78 | 1.20 ± 0.97 |
| IRAS 14303 − 1042 | M8 − 9 III | 0.72 ± 0.35 | 0.98 ± 1.18 | 1.37 ± 0.56 | −4.68 ± 1.66 | 0.59 ± 0.56 | 0.20 ± 0.86 |
| IRAS 15060+0947 | M9 III | 0.08 ± 0.27 | 2.15 ± 0.52 | 1.18 ± 0.24 | 1.34 ± 0.81 | 2.46 ± 0.71 | 3.29 ± 0.20 |
| BRI B1219 − 1336 | M9 III | 0.79 ± 0.18 | 0.75 ± 0.57 | 0.78 ± 0.24 | −0.52 ± 0.67 | 2.28 ± 0.62 | 1.23 ± 0.51 |
| DENIS−P J104814.7 − 395606.1 | M9 V | −2.79 ± 0.35 | 13.89 ± 0.49 | 1.51 ± 0.37 | 0.15 ± 0.53 | −1.17 ± 0.48 | 2.44 ± 0.31 |
| LP 944 − 20 | M9 V | −1.62 ± 0.57 | 12.27 ± 0.48 | 1.21 ± 0.44 | −0.08 ± 0.46 | −1.12 ± 0.53 | 2.34 ± 0.34 |
| LHS 2065 | M9 V | −1.41 ± 0.38 | 14.23 ± 0.41 | 1.78 ± 0.31 | 0.31 ± 0.30 | −1.30 ± 0.48 | 5.78 ± 0.26 |
| LHS 2924 | M9 V | −1.20 ± 0.44 | 13.62 ± 0.50 | 1.80 ± 0.40 | 0.05 ± 0.43 | −1.18 ± 0.52 | 4.51 ± 0.35 |
| BRI B0021 − 0214 | M9.5 V | −4.46 ± 0.87 | 13.92 ± 0.70 | 1.41 ± 0.56 | −0.24 ± 0.58 | −1.54 ± 0.65 | 2.64 ± 0.44 |
| IRAS 14086 − 0703 | M10+ III | 0.78 ± 6.59 | 5.96 ± 1.19 | 0.37 ± 0.59 | −2.43 ± 1.02 | −0.35 ± 0.55 | 0.08 ± 0.55 |
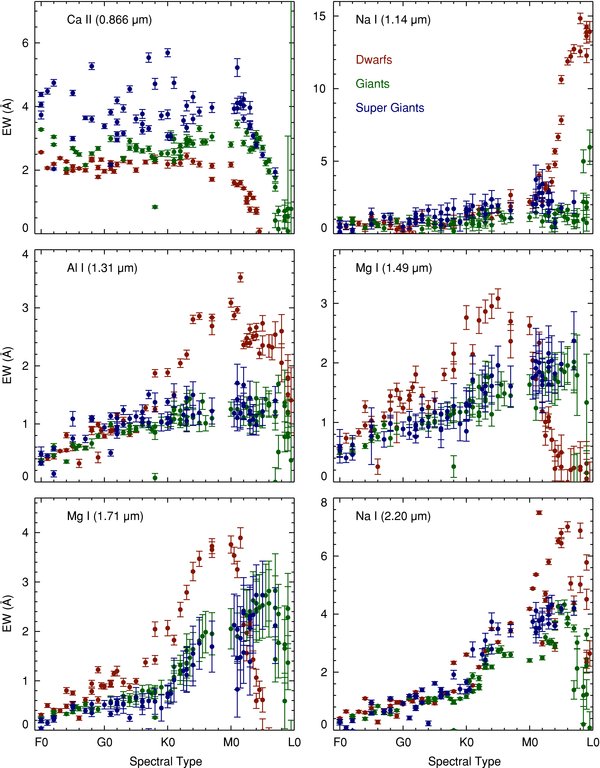
Figure 35. EWs of prominent atomic absorption lines as a function of spectral type. The Ca ii EW is a good luminosity class indicator. The Na i 2.20 μm EW provides a good indication of spectral subtype, while the Na i 1.14 μm doublet EW can be used as a clear indicator of the very latest spectral subtypes.
Download figure:
Standard image High-resolution image3.3. Molecular Band Identifications
Molecular absorption bands are prominent in the spectra of late-type stars. Identifications for many of these features can be found in Spinrad & Wing (1969), Brett (1990), Brett (1989), and Lançon & Wood (2000). Table 10 lists the vacuum wavelengths and identifications for each of the band heads identified in the spectra. Below, we describe some of the absorption bands in detail.
Table 10. Molecular Features in FGKM Spectra
| Wavelength (μm) | Transition | References |
|---|---|---|
| (1) | (2) | (3) |
| TiO | ||
| 0.82009172 R head | 1–0 band of δ (b1Π − a1Δ) | 1 |
| 0.82081 R3 head | 0–2 band of γ (A3Φ − X3Δ) | 2 |
| 0.82523 R2 head | 0–2 band of γ (A3Φ − X3Δ) | 2 |
| 0.82720357 R head | 2–1 band of δ (b1Π − a1Δ) | 1 |
| 0.82913 R3 head | 1–3 band of γ (A3Φ − X3Δ) | 2 |
| 0.83052 R1 head | 0–2 band of γ (A3Φ − X3Δ) | 2 |
| 0.83368 R2 head | 1–3 band of γ (A3Φ − X3Δ) | 2 |
| 0.83748 R3 head | 2–4 band of γ (A3Φ − X3Δ) | 2 |
| 0.83888 R1 head | 1–3 band of γ (A3Φ − X3Δ) | 2 |
| 0.84195 R2 head | 2–4 band of γ (A3Φ − X3Δ) | 2 |
| 0.8434 R1 head | 0–0 band of (E3Π − X3 Δ) |
3 |
| 0.8444 R2 head | 0–0 band of (E3Π − X3 Δ) |
3 |
| 0.8454 R3 head | 0–0 band of (E3Π − X3 Δ) |
3 |
| 0.8497 R1 head | 1–1 band of (E3Π − X3 Δ) |
3 |
| 0.85078 R2 head | 3–5 band of γ (A3Φ − X3Δ) | 2 |
| 0.8508 R2 head | 1–1 band of (E3Π − X3 Δ) |
3 |
| 0.8518 R3 head | 1–1 band of (E3Π − X3 Δ) |
3 |
| 0.85183 Q2 head | 3–5 band of γ (A3Φ − X3Δ) | 2 |
| 0.85608 R1 head | 3–5 band of γ (A3Φ − X3Δ) | 2 |
| 0.8562 R1 head | 2–2 band of (E3Π − X3 Δ) |
3 |
| 0.8571 R2 head | 2–2 band of (E3Π − X3 Δ) |
3 |
| 0.85718 Q1 head | 3–5 band of γ (A3Φ − X3Δ) | 2 |
| 0.8582 R3 head | 2–2 band of (E3Π − X3 Δ) |
3 |
| 0.886207 R head | 0–0 band of δ (b1Π − a1Δ) | 4 |
| 0.887093 Q head | 0–0 band of δ (b1Π − a1Δ) | 4 |
| 0.893983 R head | 1–1 band of δ (b1Π− a1Δ) | 4 |
| 0.90171 R head | 2–2 band of δ (b1Π − a1Δ) | 4 |
| 0.9211 R1 head | 0–1 band of (E3Π − X3 Δ) |
2 |
| 0.9221 R2 head | 0–1 band of (E3Π − X3 Δ) |
2 |
| 0.9233 R3 head | 0–1 band of (E3Π − X3 Δ) |
2 |
| 0.9279 R1 head | 1–2 band of (E3Π − X3 Δ) |
2 |
| 0.9289 R2 head | 1–2 band of (E3Π − X3 Δ) |
2 |
| 0.9300 R3 head | 1–2 band of (E3Π − X3 Δ) |
2 |
| 0.9345 R1 head | 2–3 band of (E3Π − X3 Δ) |
2 |
| 0.9356 R2 head | 2–3 band of (E3Π − X3 Δ) |
2 |
| 0.9368 R3 head | 2–3 band of (E3Π − X3 Δ) |
2 |
| 0.9728 R head | 0–1 band of δ (b1Π − a1Δ) | 5 |
| 0.9817 R head | 1–2 band of δ (b1Π − a1Δ) | 5 |
| 0.9902 R head | 2–3 band of δ (b1Π − a1Δ) | 5 |
| 0.9989 R head | 3–4 band of δ (b1Π − a1Δ) | 5 |
| 1.0027652 R head | 1–0 band of Φ (b1Π − d1Σ) | 6 |
| 1.0140301 R head | 2–1 band of Φ (b1Π − d1Σ) | 6 |
| 1.0254435 R head | 3–2 band of Φ (b1Π − d1Σ) | 6 |
| 1.1035239 R head | 0–0 band of Φ (b1Π − d1Σ) | 6 |
| 1.1160977 R head | 1–1 band of Φ (b1Π − d1Σ) | 6 |
| 1.2423352 R head | 0–1 band of Φ (b1Π − d1Σ) | 6 |
| 1.2567493 R head | 1–2 band of Φ (b1Π − d1Σ) | 6 |
| CN | ||
| 0.91092 SR21 head | 1–0 band of A2Π − X2Σ+ | 7, 8 |
| 0.91431 R2 head | 1–0 band of A2Π − X2Σ+ | 7, 8 |
| 0.91709 R1 head | 1–0 band of A2Π − X2Σ+ | 7, 8 |
| 0.91920 Q1 head | 1–0 band of A2Π − X2Σ+ | 7, 8 |
| 1.0875 SR21 head | 0–0 band of A2Π − X2Σ+ | 7, 8 |
| 1.0929 R2 head | 0–0 band of A2Π − X2Σ+ | 7, 8 |
| 1.0966 R1 head | 0–0 band of A2Π − X2Σ+ | 7, 8 |
| 1.0999 Q1 head | 0–0 band of A2Π − X2Σ+ | 7, 8 |
| 1.4078 R2 head | 0–1 band of A2Π − X2Σ+ | 7, 9 |
| 1.4138 R1 head | 0–1 band of A2Π − X2Σ+ | 7, 9 |
| 1.4549 R2 head | 1–2 band of A2Π − X2Σ+ | 7, 9 |
| 1.9649 R2 head | 3–5 band of A2Π − X2Σ+ | 10 |
| 2.0470 R2 head | 3–5 band of A2Π − X2Σ+ | 10 |
| 2.1349 R2 head | 3–5 band of A2Π − X2Σ+ | 10 |
| 2.2236 R2 head | 3–5 band of A2Π − X2Σ+ | 10 |
| CrH | ||
| 0.8613 head | 0–0 band of A6Σ+ − X6Σ+ | 8 |
| FeH | ||
| 0.8964 R head | 1–0 band of F4Δ − X4Δ | 11 |
| 0.9899 R head | 0–0 band of F4Δ − X4Δ | 11 |
| 1.1942 R head | 0–1 band of F4Δ − X4Δ | 11 |
| 1.2392 R head | 1–2 band of F4Δ − X4Δ | 11 |
| 1.58306 head | E4Π − A4Π | 12 |
| 1.59161 head | E4Π − A4Π | 12 |
| 1.62501 head | E4Π − A4Π | 12 |
| H2O | ||
| 0.89–0.99 | 3ν3,ν1 + 2ν3, 2ν1 + ν3, 3ν1,ν1 + 2ν2 + ν3, 2ν1 + 2ν2 | 13 |
| 1.09–1.20 | ν2 + 2ν3, ν1 + ν2 + ν3, 2ν1 + ν2, 3ν2 + ν3, ν1 + 2ν2 | 13 |
| 1.3–1.51 | 2ν3, ν1 + ν2, 2ν1, 2ν2 + ν3, ν1 + 2ν2 | 13 |
| 1.75–2.05 | ν2 + ν3, ν1 + ν2, 3ν2 | 13 |
| 2.3–3.2 | ν1, ν3, 2ν2 | 13 |
| ZrO | ||
| 0.93019 R3 head | 0–0 band of b3Π − a3Δ | 14 |
| 0.931801 R1(c) head | 0–0 band of b3Π − a3Δ | 14 |
| 0.931845 R1(d) head | 0–0 band of b3Π − a3Δ | 14 |
| 0.932060 head | unknown | 14 |
| 0.93317 R2 head | 0–0 band of b3Π − a3Δ | 14 |
| 0.934417 head | unknown | 14 |
| 0.935860 head | unknown | 14 |
| VO | ||
| 1.04626 SR43 head | 0–0 band of A4Π − X4Σ− | 15, 16 |
| 1.04822 RQ43 head | 0–0 band of A4Π − X4Σ− | 15, 16 |
| 1.45092 R3 head | 0–0 band of A4Π − X4Σ− | 15, 16 |
| 1.45300 RQ21 head | 0–0 band of A4Π − X4Σ− | 15, 16 |
| 1.17–1.20 | 0–1 band of A4Π − X4Σ− | 16 |
| C2 | ||
| 1.1727 head | 2–0 band of A' 3Σ−g − X' 3Πu | 17 |
| 1.7680 head | 0–0 band of A' 3Σ−g − X' 3Πu | 17 |
| 12CO | ||
| 1.5582 R head | 3–0 band of X1Σ+ − X1Σ+ | 18 |
| 1.5779 R head | 4–1 band of X1Σ+ − X1Σ+ | 18 |
| 1.5982 R head | 5–2 band of X1Σ+ − X1Σ+ | 18 |
| 1.6189 R head | 6–3 band of X1Σ+ − X1Σ+ | 18 |
| 1.6401 R head | 7–4 band of X1Σ+ − X1Σ+ | 18 |
| 1.6618 R head | 8–5 band of X1Σ+ − X1Σ+ | 18 |
| 1.6840 R head | 9–6 band of X1Σ+ − X1Σ+ | 18 |
| 1.7067 R head | 10–7 band of X1Σ+ − X1Σ+ | 18 |
| 1.7230 R head | 11–8 band of X1Σ+ − X1Σ+ | 18 |
| 1.7538 R head | 12–9 band of X1Σ+ − X1Σ+ | 18 |
| 2.2935 R head | 2–0 band of X1Σ+ − X1Σ+ | 18 |
| 2.3227 R head | 3–1 band of X1Σ+ − X1Σ+ | 18 |
| 2.3525 R head | 4–2 band of X1Σ+ − X1Σ+ | 18 |
| 2.3830 R head | 5–3 band of X1Σ+ − X1Σ+ | 18 |
| 2.4141 R head | 6–4 band of X1Σ+ − X1Σ+ | 18 |
| 13CO | ||
| 2.3448 R head | 2–0 band of X1Σ+ − X1Σ+ | 18 |
| 2.3739 R head | 3–1 band of X1Σ+ − X1Σ+ | 18 |
| 2.4037 R head | 4–2 band of X1Σ+ − X1Σ+ | 18 |
| 2.4341 R head | 5–3 band of X1Σ+ − X1Σ+ | 18 |
| OH | ||
| 3.4–4.2 series | 1–0 bands of X2Π − X2Π | 19 |
| 3.4–4.2 series | 2–1 bands of X2Π − X2Π | 19 |
| SiO | ||
| 4.0042 R head | 2–0 band of X1Σ+ − X1Σ+ | 20 |
| 4.0437 R head | 3–1 band of X1Σ+ − X1Σ+ | 20 |
| 4.0838 R head | 4–2 band of X1Σ+ − X1Σ+ | 20 |
| 4.1247 R head | 5–3 band of X1Σ+ − X1Σ+ | 20 |
| 4.1663 R head | 5–3 band of X1Σ+ − X1Σ+ | 20 |
References. (1) Valenti et al. 1998; (2) Gatterer et al. 1957; (3) Linton & Broida 1977; (4) Phillips 1950; (5) Lockwood 1973; (6) Galehouse et al. 1980; (7) Pearse & Gaydon 1965; (8) Pearse & Gaydon 1976; (9) Herzberg & Phillips 1948; (10) Brocklehurst et al. 1971; (11) Phillips et al. 1987; (12) Wallace & Hinkle 2001; (13) Auman 1967; (14) Phillips et al. 1979; (15) Lagerqvist & Selin (1957); (16) Cheung et al. (1982); (17) Ballik & Ramsay 1963; (18) Goorvitch 1994; (19) Hinkle et al. 1995; (20) Beer et al. (1974).
3.3.1. TiO
Absorption bands of TiO that arise from the γ (A3Φ − X3Δ), (E3Π − X3Δ), δ (b1Π − a1Δ), and ϕ (b1Π − d1Σ) systems are conspicuous in the spectra of late-type stars over the 0.8–1.5 μm wavelength range (see Figures 7–9, 12, 28–30). The γ and systems involve triplet electronic states and thus exhibit triple-headed bands, while the δ and ϕ systems involve singlet electronic states and thus exhibit only single-headed bands.
The Δν = −2 bands of the γ system (0.82–0.86 μm) are often identified in both low and high resolution spectra of late-type stars (e.g., Kirkpatrick et al. 1991; Tinney & Reid 1998; Reiners et al. 2007). In particular, four TiO band heads (R2, Q2, R1, Q1) are identified between 0.849 and 0.860 μm (see Figures 12 and 36). However, as can be seen in both our data and the high-resolution spectra of late-type M and early-type L dwarfs, (Tinney & Reid 1998; Reiners et al. 2007), two additional band heads of similar depths exist at 0.8508 and 0.8582 μm. Together, the six-band heads appear to form two sets of triplet band heads. The 1–1 and 2–2 bands of the system exhibit band heads at these wavelengths and therefore it is likely that these features arise from the system alone or are a combination of the γ and systems. We also note that three of the Δν = −2 band head classifications listed in Gatterer et al. (1957) were marked as uncertain so we have confirmed these using the theoretical line list of Schwenke (1998).
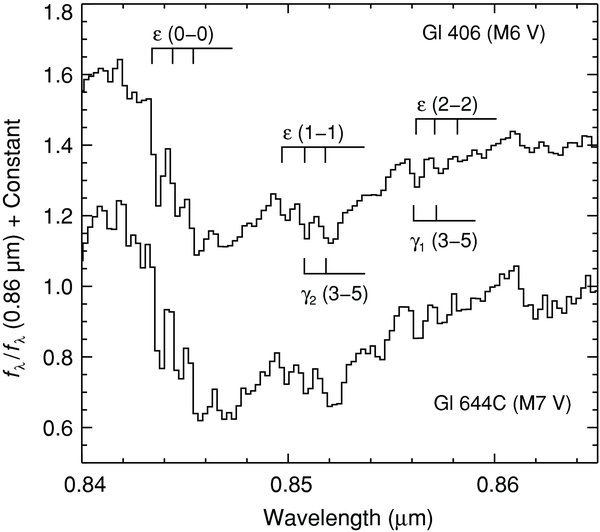
Figure 36. Spectrum of Gl 406 (M6 V) and Gl 644C (vB 8, M7 V) centered on the Δν = 0 system of TiO. The 0–0, 1–1, and 2–2 bands are indicated. Also indicated are the Δν = −2 band heads of the γ system. The set of band heads at ∼0.853 μm and ∼0.858 μm are most likely a combination of both the and γ systems even though only the γ heads are indicated in the literature.
Download figure:
Standard image High-resolution imageIt has been known for some time that absorption bands of TiO are present in the spectra of M giant stars near 0.93 μm (Spinrad & Newburn 1965). However, to our knowledge, these bands were not detected in the spectra of M dwarfs until the work of Cushing & Vacca (2006). These band heads arise from the Δν = −1 band of the system. Although telluric and intrinsic H2O absorptions make identifications in this region difficult, we nevertheless are able to identify the triplet band heads of the 0–1 (0.9211, 0.9221, 0.9233 μm), 1–2 (0.9279, 0.9289, 0.9300 μm), and 2–3 (0.9345, 0.9356, 0.9368 μm) transitions (see Figures 12 and 28). Finally, we note that while the wavelengths of the 2–3 and 3–4 band heads measured by Linton & Broida (1977) agree with our observations, they do not match the positions of the band heads predicted by Schwenke (1998).
3.3.2. VO
Absorption bands that arise from the B4Π − X4Σ+ 9 and A4Π −X4Σ− systems of VO are present in the spectra of M stars over the 0.8–1.3 μm wavelength range. We identify only the 0–0 (∼1.06 μm) and 0–1 (∼1.18 μm) bands of the A4Π −X4Σ− system (see Figures 8, 13, and 29). Although there are certainly absorption features arising from the 0–1 band of B4Π − X4Σ+ system centered near ∼0.85 μm in the spectra of late-type stars (Keenan & Schroeder 1952; Tinney & Reid 1998), they are simply too weak to be detected in our data.
3.3.3. ZrO
A series of four ZrO band heads arising from the 0–0 band of the system b3Π − a3Δ of ZrO (Phillips et al. 1979) are found in the spectra of M giant stars and carbon stars (see Figures 9, 21, 28, 34). Three additional band heads are also present at 0.932060, 0.934417, and 0.935860 μm but their corresponding transitions are unknown. Only three of the band heads (R1(c), R1(d), and 0.932060 μm) can be conclusively identified in the spectra given the complexity of the spectra at these wavelengths, but we include the other band heads for completeness. Additional ZrO band heads (Hammer & Davis 1981; Joyce et al. 1998) in the 1.0–1.2 μm wavelength range are not seen in our spectra.
3.4. Variations of Spectral Features with Spectral Type and Luminosity
In the following sections, we describe the variations of spectral features with spectral type and luminosity of the stars in our sample. These changes are illustrated with the representative spectra given in Figures 7–34, which include feature identifications. Technically, these identifications are only correct for Arcturus and the Sun, so we have identified the features over only Arcturus and a solar analog HD 76151 (G2 V). We caution against assuming that the same lines are present at much earlier and later spectral types than K1.5 III and G2 V.
Many of the features and variations in their strengths have been previously recognized: Joyce et al. (1998) and Wallace et al. (2000) at J; Meyer et al. (1998) at H; Kleinmann & Hall (1986), Wallace & Hinkle (1996, 1997) at K; Wallace & Hinkle (2002) and Vandenbussche et al. (2002) at L; Lançon & Rocca-Volmerange (1992) at 1.4–2.5 μm for normal stars; Lançon & Wood (2000) at 0.5–2.5 μm for luminous cool stars; and Loidl et al. (2001, 0.5–2.5 μm) and Aoki et al. (1998, 3–8 μm) for carbon stars.
The spectra are also used to compute synthetic photometric colors (see Section 4.2). Synthesized J – H versus H – K color–color diagrams are given in Figures 37 and 38. Figure 39 shows the spectral behavior of several late-type M giant stars plotted in Figures 37 and 38. A synthesized Y – J versus J – H color–color diagram is given in Figure 40. More complete spectral sequences are plotted in the Appendix (Figures 41–112) but without feature identifications.
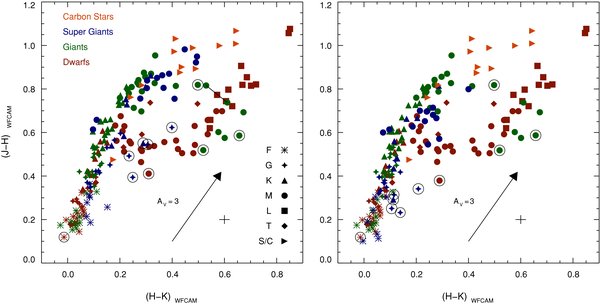
Figure 37. Left: synthesized WFCAM J − H versus H − K diagram for our sample of cool stars (see Table 11), plus additional L and T dwarfs from Cushing et al. (2005) and T dwarfs from Burgasser et al. (2006). Several objects with extreme colors fall outside the plotted range and are plotted in Figure 38. Note the bifurcation between dwarfs and stars of higher luminosity beyond spectral type M0 V. Stars with odd spectra are circled (see Section 4.3). HD 69243 (M6e–M9e III, Mira variable) was observed at two epochs and the change in color is indicated (see also Figure 39). The + sign indicates the accuracy of the photometry, and the arrow indicates the direction and magnitude of the reddening vector for AV = 3. Right: the same plot but now with the correction for reddening included (the 66 dereddened stars are given in Table 5). Note how most M supergiant stars move closer to the main sequence.
Download figure:
Standard image High-resolution image
Figure 38. Same as Figure 37 except all stars are plotted. The additional stars include some very red Mira and OH/IR stars, plus several blue T dwarfs. The colors of the Mira and OH/IR stars follow the linear locus (dashed line) expected from models of circumstellar dust shells in TPAGB stars (e.g., Lewis 2006).
Download figure:
Standard image High-resolution image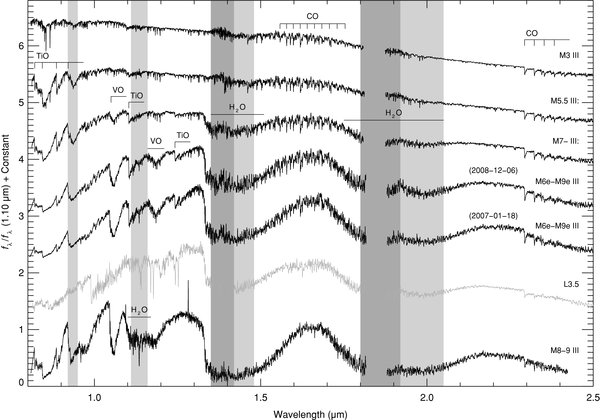
Figure 39. Spectral behavior of M giant stars along the locus of decreasing J − H and increasing H − K in Figure 37 (plotted from the top). Strong water absorption at 1.4 μm and 1.9 μm reduces the flux emitted at H relative to J and K. As a result, the locus of M giant stars in the J − H versus H − K diagram appears to turn down toward late-M and early-L dwarfs (see Section 4.2 and Figure 37). The spectra plotted (black) are HD 39045 (M3 III), HD 94705 (M5.5 III:), HD 108849 (M7− III:), HD 69243 (M6e–M9e III) on 2008 December 6, HD 69243 (M6e–M9e III) on 2007 January 18, and IRAS 14303 − 1042 (M8–9 III). Also plotted is the spectrum (gray) of 2MASS J00361617+1821104 (L3.5; Cushing et al. 2005) which has very similar JHK colors to HD 69243 (M6e–M9e III).
Download figure:
Standard image High-resolution image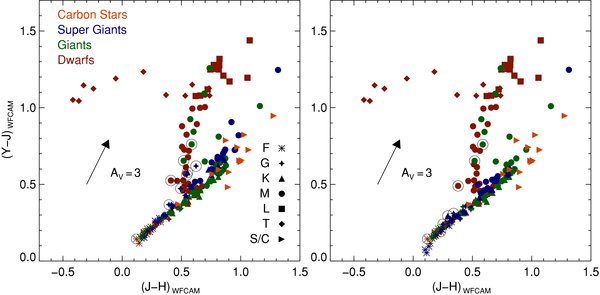
Figure 40. Left: synthesized WFCAM Y − J versus J − H diagram for our sample of cool stars (see Table 11), plus additional L and T dwarfs from Cushing et al. (2005) and T dwarfs from Burgasser et al. (2006). The plot illustrates the advantage of using a Y filter when trying to identify T dwarfs compared to using JHK colors (see Figure 37) and is an example of using the library to experiment with other photometric systems. Note the bifurcation between dwarfs and stars of higher luminosity beyond the spectral type M0 V. Several late-type M giants have similar colors to late-type dwarfs since both have water absorption in the NIR. Right: the same plot but now with the correction for reddening included (the 66 dereddened stars are given in Table 5). Note how most M supergiant stars move closer to the main sequence.
Download figure:
Standard image High-resolution image3.4.1. F Stars
Representative F star spectra are shown in Figures 7–9, 12–18, and 22–27. The NIR spectra of F stars are dominated by the neutral hydrogen (H i) absorption lines of the Paschen (n = 3), Brackett (n = 4), Pfund (n = 5), and Humphreys (n = 6) series, in order of increasing wavelength and decreasing strength. The Brackett series (H band) is a good luminosity indicator, smoothly decreasing in strength from supergiants through giants to dwarfs (Figures 15, 18, and 25). The Pfund series (K band, series limit 2.33 μm) can also be strong in early F supergiants (Figure 9). Between the H i lines, spectra are dominated by features due to neutral metal species (e.g., Si i at 1.06–1.09 μm and 1.16–1.21 μm; Figures 23 and 24). The strongest feature in the spectra is the Ca ii triplet at 0.86 μm (Figure 22). The only indication of molecular absorption is the very weak CN feature at 1.09 μm in the latest-type F stars (Figure 9).
3.4.2. G Stars
Representative G star spectra are shown in Figures 7–9, 12–17, 19, and 22–27. H i absorption weakens significantly toward late-type G stars while the neutral metals are stronger than seen in F stars, although the strongest feature is again the Ca ii triplet at 0.86 μm (Figures 7–9). The strongest neutral metal lines are those due to Mg (in the H band at about 1.50 μm, 1.58 μm, and 1.71 μm; Figure 25). Molecular absorption due to CO and CN strengthens with decreasing effective temperature in G stars and these also provide the best luminosity indicators. The first CO overtone bands in the K band (∼2.29–2.5 μm) are strongest in supergiants and become progressively weaker with decreasing luminosity (Figure 26). The CN band head at 1.09 μm weakens with decreasing luminosity in mid- to late-type G stars (Figure 23).
3.4.3. K Stars
Representative K star spectra are shown in Figures 7–9, 12–17, 20, and 28–33. H i absorption becomes very weak in K stars and is effectively absent by late K (e.g., Brackett γ in Figure 16, with a slight dependence on luminosity). Neutral metal absorption features reach a maximum depth in the spectra of K and M stars and lines due to Al i at 1.31 μm, Mg i at about 1.50 μm and 1.53 μm, Al i at 1.67 μm, and Mg i at 1.71 μm are particularly strong in the spectra of K dwarfs and early-M dwarfs (Figures 14 and 15). Lines from ionized metals weaken with progressively later spectral types (e.g., Ca ii triplet at 0.86 μm; Figures 7–9). Molecular absorption continues to strengthen in K stars as effective temperature falls. The broad H-band bump due to the H− opacity minimum at 1.6 μm first becomes evident in early-type K stars and strengthens with decreasing effective temperature (Figure 8). This feature was first observed in the pioneering balloon observations of Woolf et al. (1964). Molecular features present in the spectra of K stars are the second CO overtone vibration–rotation bands in the H band (Figure 31), the CN band head at 1.40 μm (Figures 8 and 9), OH (1–0 and 2–1) in the L band (Figure 33), the SiO first overtone vibration–rotation band at 4.00–4.18 μm (Figure 33), as well as the first overtone CO (K band; Figure 32) and CN bands (band heads at 0.91 μm and 0.94 μm; Figure 9) that are also visible in the spectra of G stars. Molecular features weaken with decreasing luminosity class and provide some of the best surface gravity indicators in K stars; the CO, CN, and SiO features are particularly sensitive to surface gravity. Other luminosity class indicators include Mg i at 1.49 μm and 1.71 μm; Figure 31). These lines are significantly stronger in dwarfs than in giants and supergiants of the same spectral type (see Figure 35).
3.4.4. M Stars
Representative M star spectra are shown in Figures 7–9, 12–17, 21, and 28–33. Molecular absorption features dominate the spectra of M stars. The CO (H band and band heads in the K band starting at 2.3 μm; Figure 9), OH (band heads starting at 3.4 μm, Figures 33 and 112), and SiO absorption bands (band heads starting at 4.0 μm; Figures 33 and 112) are strongest in early-type M supergiant stars (see Table 10). TiO (several band heads starting at 0.82 μm) and ZrO (band head at 0.93 μm) absorption also increases from mid-M to later spectral types in supergiants (Figures 21 and 97). Similar trends are seen in M giants with the addition of significant broad H2O absorption at about 1.4 μm, 1.9 μm, and 2.7 μm, starting at about M6 III (Figures 8 and 39), and with ZrO replaced by VO (band heads at 1.03 μm and 1.17 μm; Figure 8) in late-type M giants (TPAGB stars). The H-band bump first seen in the spectra of early-type K stars is strongest in mid-type M giants and supergiants (Figures 8 and 9). The H-band spectra of M dwarfs are dominated by numerous FeH absorption features (Figure 15, and Figure 7 of Cushing et al. 2003). In M stars the best luminosity class indicators are the FeH band head at 0.99 μm (Figure 29; Wing & Ford 1969), the second CO overtone bands in the H band (strong in M supergiants and giants; Figure 31), the first CO overtone bands in the K band (strong in M supergiants and giants; Figure 32), and the first SiO overtone bands at about 4.0 μm (strong in M supergiants and giants; Figure 33). Most neutral metal features weaken in the late-M spectral types (e.g., Ca i triplet at 2.26 μm; Figures 16 and 108). The exceptions are the alkali lines, namely the Na i doublets at 0.82 μm, 1.14 μm, and 2.20 μm, and the K i doublets at 1.17 μm and 1.25 μm (Figures 28, 30, and 32). These lines are strong in mid- to late-type M dwarfs and weak in corresponding supergiants and giants, and are consequently excellent luminosity class or surface gravity indicators. The Ca ii triplet at 0.86 μm is significantly weaker in M stars relative to earlier spectral types where it blends with TiO absorption (Figure 12) and is absent by mid- to late-type M stars (slightly dependent upon luminosity; Figures 95–97).
3.4.5. Carbon and S Stars
The sequence M–MS–S–SC–C is thought to be one of increasing carbon-to-oxygen ratio as well as increasing s-process element abundance during AGB evolution (Ake 1979). Our sample contains one MS, four S, five C–N, one C-R, and two C-J stars (see Table 2). In normal (oxygen-rich, C < O) M giants, some of the oxygen is used up to make CO but most of it goes into making metal oxides such as TiO. In typical carbon stars (C > O) all the oxygen is used up in the production of CO and the remaining carbon goes into carbon compounds such as C2, CH, CN, and C3. The TiO so characteristic of M stars is replaced by these carbon compounds. The so-called S stars (C ∼ O) are intermediate between C stars and M giants. Zirconium has a stronger affinity for oxygen than for titanium, but is much less abundant, so in normal M stars, ZrO features are weak or absent. With increasing Zr abundance due to the s-process, any oxygen remaining from CO formation goes into ZrO and so in S stars ZrO predominates and TiO is weakened.
In the optical, the continuum of most carbon stars is largely obscured by absorption features from carbon compounds. Consequently, it is very difficult to use the standard atomic lines to sort spectra into types that can be calibrated in terms of effective temperature, luminosity, and composition (i.e., a three-dimensional MK system). Nevertheless, improved optical spectra have led to a revised MK classification scheme for C stars due to Keenan (1993) and Barnbaum et al. (1996). In this scheme, the notation C-Rx, C-Jx, C–Nx, C-Lx, and C-Hx corresponds to different spectral types, where increasing digit x represents decreasing effective temperature. Although the spectral types probably represent different stellar populations, the types are defined entirely by features in the observed spectra (see Table 2; Barnbaum et al. 1996). Due to differences in mass, original composition, and environment, not all carbon stars are enriched in the same way. In terms of evolutionary status, the spectral types C-R, C-J, C–N, C-L, and C-H are thought to characterize red giants, giants, TPAGB stars, PAGB stars, and binary stars undergoing mass transfer, respectively. Further symbols can be added to the notation to indicate luminosity class and composition (for details of the notation, see Barnbaum et al. 1996).
The spectral classification scheme as developed by Keenan & McNeil (1976) and revised by Ake (1979) for S stars is similar to that of C stars. The notation Sx indicates S-star effective temperature, where increasing x digit represents decreasing effective temperature. Additional symbols can be added to indicate composition. However, the effective temperature sequence of S stars relative to C stars is uncertain.
Figure 34 shows a sequence of M, S, and C–N giants, all of approximately the same effective temperature, illustrating the effects of increasing carbon enrichment and presumed AGB evolution. The M0 IIIb star shows features typical of late giant stars—strong CO absorption features in the H and K bands, the Ca ii triplet and a TiO band head at about 0.85 μm, a CN band head at about 1.1 μm, and the SiO absorption series at about 4 μm. The S star (S4.5 Zr 2 Ti 4) is similar except for a strong ZrO band head at about 0.93 μm. The two carbon stars (both C–N 4.5) display the effects of increasing carbon enrichment (C2 4.5 and C2 5.5, respectively). In addition to the first overtone CO band at about 2.29 μm, which is present in the M giant and S star, strong CN band heads are observed at 0.9 μm, 1.1 μm, and 1.4 μm, together with C2 absorption at about 1.2 μm and 1.75 μm, and C2H2 and HCN features at about 3.1 μm. The very cool carbon star R Lep (HD 31996, C7,6e (N4)) shows additional absorption features due to HCN and C2H2 at 1.65 μm and 2.5 μm, the HCN υ1 + υ2 bands at 3.56 μm, and the broad blend of the CS first overtone and HCN υ1 − υ2 bands at ∼3.9 μm. The HCN, C2H2, and CS features are identified by Goebel et al. (1980) and Aoki et al. (1998) (but are not given in Table 10).
4. EXAMPLE APPLICATIONS OF THE LIBRARY
Potential applications of the IRTF Spectral Library can take advantage of the 0.8–5 μm wavelength range at R ∼ 2000, preserved spectral continuum shape and absolute flux calibration. For example, the library has been used to model the atmospheres of cool dwarfs (Cushing et al. 2008), confirm the presence of a gapped primordial disk around LkCa15 (Espaillat et al. 2008), and investigate the stellar populations and activity in the nuclei of Seyfert galaxies (Ramos Almeida et al. 2009). Technical applications include using the spectra to design filters and to calibrate different photometric systems. This is made possible because the system response and telluric effects are carefully removed from our spectra. Of the many potential applications, in this section we discuss just two: the measurement of equivalent widths for spectral typing, and synthetic photometry.
4.1. Equivalent Widths
As an example of the quantitative analysis that can be carried out with the spectra in our library, we have calculated the EWs of several prominent features seen in the data (Ca ii, Na i, Al i, and Mg i) following the technique described by Cushing et al. (2005). The wavelength ranges used to define the continuum and the features are given in Table 8 and the EW values are given in Table 9. As Figure 35 clearly demonstrates, the Ca ii EW provides a fairly good discriminator of luminosity class between spectral types F and early M; the observed ranges of Ca ii EW values are seen to be remarkably narrow, particularly for the dwarfs, with little overlap among the luminosity classes. Similarly, the Na i 2.20 μm feature increases monotonically with spectral type (temperature) between early F and mid M and therefore provides an approximate means of estimating a stellar spectral type, although the uncertainty in the classification can be fairly large (± few spectral subtypes). The remarkably large, sudden, and monotonic increase in the Na i 1.14 μm doublet EW beginning at early M implies that this line can be used as a clear indicator of the very latest spectral subtypes. There are many other features in NIR spectra, in addition to what we have presented here, that can be used to determine spectral classes (e.g., Kleinmann & Hall 1986; Meyer et al. 1998; Wallace et al. 2000; Förster Schreiber 2000; Ivanov et al. 2004; Lançon et al. 2007; Davies et al. 2007).
4.2. Synthetic Colors
Because our spectra are flux calibrated and the spectra slopes are reliable, the IRTF Spectral Library can also be used to compute synthetic magnitudes and colors as well as transformations between various photometric systems. Table 11 gives the synthetic Z − Y, Y − J, J − H, H − K, and K − L' colors of the cool stars in the library derived using Equation (5). Synthesized J − H versus H − K color–color diagrams for our sample of cool stars are given in Figure 37 (0.0 < J − H < 1.2) and Figure 38 (−0.5 < J − H < 2.5). Figure 39 shows the spectral behavior of several late-type M giant stars that are plotted in Figures 37 and 38. A synthesized Y − J versus J − H diagram of the same stars is given in Figure 40 (all stars except two very red OH/IR stars). The sample of 13 L and two T dwarfs from Cushing et al. (2005) and the eight T dwarf spectral standards from Burgasser et al. (2006) are also included in these figures and table. In addition, Figures 37 and 40 also include color–color diagrams with the corrections for reddening discussed in Section 2.3 incorporated.
Table 11. Synthetic WFCAM Colors
| Object | Spectral Type | Z − Y (mag) | Y − J (mag) | J − H (mag) | H − K (mag) | K − L' (mag) |
|---|---|---|---|---|---|---|
| (1) | (2) | (3) | (4) | (5) | (6) | (7) |
| HD 7927 | F0 Ia | +0.161 | +0.211 | +0.257 | +0.152 | +0.208 |
| HD 135153 | F0 Ib−II | +0.113 | +0.153 | +0.186 | +0.087 | +0.044 |
| HD 6130 | F0 II | +0.147 | +0.193 | +0.225 | +0.090 | +0.128 |
| HD 89025 | F0 IIIa | +0.052 | +0.147 | +0.161 | +0.033 | +0.058 |
| HD 13174 | F0 III−IVn | +0.066 | +0.155 | +0.153 | +0.018 | +0.053 |
| HD 27397 | F0 IV | +0.058 | +0.115 | +0.107 | −0.011 | −0.018 |
| HD 108519 | F0 V(n) | +0.043 | +0.116 | +0.144 | +0.044 | +0.018 |
| HD 173638 | F1 II | +0.187 | +0.200 | +0.222 | +0.083 | +0.088 |
| HD 213135 | F1 V | +0.045 | +0.162 | +0.175 | +0.021 | +0.028 |
| BD +38 2803 | F2−F5 Ib | +0.106 | +0.257 | +0.304 | +0.085 | +0.096 |
| HD 182835 | F2 Ib | +0.158 | +0.196 | +0.214 | +0.073 | ... |
| HD 40535 | F2 III−IV | +0.079 | +0.173 | +0.185 | +0.046 | +0.065 |
| HD 164136 | kA9hF2mF2 (IV) | +0.080 | +0.197 | +0.210 | +0.031 | +0.110 |
| HD 113139 | F2 V | +0.084 | +0.187 | +0.184 | +0.026 | −0.092 |
| HD 26015 | F3 V | +0.061 | +0.144 | +0.119 | −0.014 | −0.045 |
| HD 21770 | F4 III | +0.050 | +0.168 | +0.181 | +0.030 | +0.068 |
| HD 87822 | F4 V | +0.065 | +0.182 | +0.182 | +0.038 | +0.052 |
| HD 16232 | F4 V | +0.050 | +0.175 | +0.207 | +0.035 | +0.113 |
| HD 213306 | F5 Ib − G1 Ib | +0.181 | +0.295 | +0.363 | +0.084 | +0.029 |
| HD 186155 | F5 II−III | +0.047 | +0.159 | +0.158 | +0.039 | −0.007 |
| HD 17918 | F5 III | +0.082 | +0.184 | +0.190 | +0.013 | +0.019 |
| HD 218804 | F5 V | +0.082 | +0.206 | +0.242 | +0.058 | +0.073 |
| HD 27524 | F5 V | +0.036 | +0.173 | +0.183 | +0.028 | +0.045 |
| HD 75555 | F5.5 III−IV | +0.088 | +0.210 | +0.212 | +0.046 | ... |
| HD 160365 | F6 III−IV | +0.033 | +0.159 | +0.174 | −0.028 | +0.012 |
| HD 11443 | F6 IV | +0.065 | +0.184 | +0.243 | +0.088 | −0.009 |
| HD 215648 | F6 V | +0.072 | +0.212 | +0.230 | +0.037 | ... |
| HD 201078 | F7 II– | +0.099 | +0.201 | +0.231 | +0.081 | ... |
| HD 124850 | F7 III | +0.093 | +0.222 | +0.241 | +0.032 | ... |
| HD 126660 | F7 V | +0.055 | +0.194 | +0.217 | +0.061 | +0.042 |
| HD 190323 | F8 Ia | +0.174 | +0.262 | +0.278 | +0.074 | +0.067 |
| HD 51956 | F8 Ib | +0.144 | +0.280 | +0.312 | +0.083 | +0.003 |
| HD 220657 | F8 III | +0.119 | +0.278 | +0.328 | +0.111 | +0.122 |
| HD 111844 | F8 IV | +0.044 | +0.119 | +0.105 | +0.009 | ... |
| HD 219623 | F8 V | +0.103 | +0.222 | +0.258 | +0.056 | −0.012 |
| HD 27383 | F8 V | +0.086 | +0.194 | +0.213 | +0.021 | −0.017 |
| HD 102870 | F8.5 IV−V | +0.076 | +0.220 | +0.251 | +0.043 | +0.033 |
| HD 6903 | F9 IIIa | +0.127 | +0.268 | +0.320 | +0.072 | +0.043 |
| HD 176051 | F9 V | +0.089 | +0.254 | +0.324 | +0.054 | −0.037 |
| HD 165908 | F9 V metal weak | +0.036 | +0.189 | +0.235 | +0.062 | +0.058 |
| HD 114710 | F9.5 V | +0.060 | +0.194 | +0.198 | −0.006 | +0.025 |
| HD 185018 | G0 Ib−II | +0.173 | +0.303 | +0.364 | +0.085 | +0.007 |
| HD 109358 | G0 V | +0.079 | +0.235 | +0.294 | +0.034 | +0.010 |
| HD 74395 | G1 Ib | +0.175 | +0.298 | +0.348 | +0.086 | +0.062 |
| HD 216219 | G1 II−III: Fe−1 CH0.5 | +0.096 | +0.232 | +0.274 | +0.054 | +0.061 |
| HD 21018 | G1 III: CH−1: | +0.175 | +0.305 | +0.353 | +0.102 | +0.066 |
| HD 10307 | G1 V | +0.092 | +0.233 | +0.281 | +0.037 | +0.029 |
| HD 95128 | G1− V Fe−0.5 | +0.110 | +0.253 | +0.273 | +0.045 | ... |
| HD 20619 | G1.5 V | +0.122 | +0.278 | +0.344 | +0.077 | +0.053 |
| HD 42454 | G2 Ib | +0.264 | +0.369 | +0.415 | +0.122 | ... |
| HD 39949 | G2 Ib | +0.250 | +0.361 | +0.424 | +0.118 | ... |
| HD 3421 | G2 Ib−II | +0.175 | +0.289 | +0.370 | +0.075 | +0.076 |
| HD 219477 | G2 II−III | +0.125 | +0.269 | +0.320 | +0.065 | ... |
| HD 126868 | G2 IV | +0.107 | +0.246 | +0.318 | +0.074 | +0.090 |
| HD 76151 | G2 V | +0.100 | +0.250 | +0.304 | +0.083 | +0.044 |
| HD 192713 | G3 Ib−II Wk H&K comp? | +0.226 | +0.345 | +0.422 | +0.108 | +0.085 |
| HD 176123 | G3 II | +0.211 | +0.345 | +0.410 | +0.089 | +0.098 |
| HD 88639 | G3 IIIb Fe−1 | +0.169 | +0.318 | +0.394 | +0.069 | +0.112 |
| HD 10697 | G3 Va | +0.140 | +0.279 | +0.331 | +0.088 | +0.082 |
| HD 179821 | G4 O−Ia | +0.301 | +0.368 | +0.394 | +0.249 | +0.239 |
| HD 6474 | G4 Ia | +0.408 | +0.472 | +0.492 | +0.235 | +0.217 |
| HD 94481 | G4 III−IIIb | +0.163 | +0.311 | +0.402 | +0.083 | ... |
| HD 108477 | G4 III | +0.181 | +0.319 | +0.399 | +0.099 | +0.096 |
| HD 214850 | G4 V | +0.103 | +0.273 | +0.395 | +0.108 | +0.059 |
| HD 190113 | G5 Ib | +0.300 | +0.428 | +0.531 | +0.150 | +0.133 |
| HD 18474 | G5: III: CN−3 CH−2 Hδ−1 | +0.162 | +0.313 | +0.420 | +0.045 | +0.074 |
| HD 193896 | G5 IIIa | +0.229 | +0.363 | +0.449 | +0.124 | ... |
| HD 165185 | G5 V | +0.056 | +0.218 | +0.259 | +0.055 | −0.014 |
| HD 161664 | G6 Ib Hδ1 | +0.397 | +0.490 | +0.565 | +0.179 | +0.185 |
| HD 202314 | G6 Ib−IIa Ca1 Ba0.5 | +0.239 | +0.357 | +0.451 | +0.162 | +0.161 |
| HD 58367 | G6 IIb | +0.203 | +0.335 | +0.434 | +0.099 | +0.131 |
| HD 27277 | G6 III | +0.238 | +0.354 | +0.420 | +0.094 | +0.093 |
| HD 115617 | G6.5 V | +0.086 | +0.232 | +0.285 | +0.020 | −0.031 |
| HD 333385 | G7 Ia | +0.557 | +0.562 | +0.545 | +0.306 | +0.594 |
| HD 25877 | G7 II | +0.206 | +0.328 | +0.400 | +0.076 | +0.081 |
| HD 182694 | G7 IIIa | +0.157 | +0.318 | +0.408 | +0.107 | +0.044 |
| HD 20618 | G7 IV | +0.181 | +0.331 | +0.439 | +0.098 | +0.093 |
| HD 114946 | G7 IV | +0.165 | +0.328 | +0.451 | +0.094 | +0.120 |
| HD 16139 | G7.5 IIIa | +0.226 | +0.357 | +0.458 | +0.130 | +0.078 |
| HD 208606 | G8 Ib | +0.411 | +0.494 | +0.596 | +0.202 | +0.099 |
| HD 122563 | G8: III: Fe−5 | +0.204 | +0.374 | +0.532 | +0.112 | +0.051 |
| HD 104979 | G8 III Ba1 CN0.5 CH1 | +0.184 | +0.337 | +0.486 | +0.098 | +0.132 |
| HD 135722 | G8 III Fe−1 | +0.185 | +0.343 | +0.495 | +0.120 | −0.006 |
| HD 101501 | G8 V | +0.133 | +0.270 | +0.332 | +0.062 | +0.012 |
| HD 75732 | G8 V | +0.148 | +0.290 | +0.364 | +0.103 | +0.071 |
| HD 170820 | G9 II CN1 Hδ1 | +0.455 | +0.541 | +0.613 | +0.221 | +0.157 |
| HD 222093 | G9 III | +0.202 | +0.367 | +0.503 | +0.102 | +0.070 |
| HD 165782 | K0 Ia | +0.584 | +0.579 | +0.551 | +0.289 | ... |
| HD 44391 | K0 Ib | +0.303 | +0.429 | +0.540 | +0.168 | +0.117 |
| HD 179870 | K0 II | +0.274 | +0.386 | +0.439 | +0.048 | −0.016 |
| HD 100006 | K0 III | +0.235 | +0.380 | +0.531 | +0.104 | +0.109 |
| HD 145675 | K0 V | +0.140 | +0.290 | +0.340 | +0.058 | −0.017 |
| HD 164349 | K0.5 IIb | +0.250 | +0.371 | +0.470 | +0.074 | ... |
| HD 9852 | K0.5 III CN1 | +0.348 | +0.472 | +0.601 | +0.153 | +0.092 |
| HD 63302 | K1 Ia−Iab | +0.383 | +0.486 | +0.584 | +0.215 | +0.205 |
| HD 36134 | K1− III Fe−0.5 | +0.229 | +0.390 | +0.538 | +0.097 | +0.097 |
| HD 91810 | K1− IIIb CN1.5 Ca1 | +0.263 | +0.401 | +0.528 | +0.134 | +0.138 |
| HD 25975 | K1 III | +0.149 | +0.312 | +0.424 | +0.075 | +0.042 |
| HD 165438 | K1 IV | +0.194 | +0.350 | +0.454 | +0.098 | ... |
| HD 142091 | K1 IVa | +0.199 | +0.341 | +0.454 | +0.084 | ... |
| HD 10476 | K1 V | +0.147 | +0.317 | +0.405 | +0.095 | +0.031 |
| HD 124897 | K1.5 III Fe−0.5 | +0.246 | +0.420 | +0.651 | +0.127 | +0.076 |
| HD 212466 | K2 O−Ia | +0.635 | +0.619 | +0.623 | +0.399 | +0.302 |
| HD 2901 | K2 III Fe−1 | +0.284 | +0.436 | +0.605 | +0.096 | +0.125 |
| HD 132935 | K2 III | +0.298 | +0.462 | +0.661 | +0.164 | +0.127 |
| HD 137759 | K2 III | +0.264 | +0.420 | +0.564 | +0.140 | ... |
| HD 3765 | K2 V | +0.166 | +0.330 | +0.420 | +0.080 | +0.049 |
| HD 23082 | K2.5 II | +0.457 | +0.550 | +0.699 | +0.204 | +0.199 |
| HD 187238 | K3 Iab−Ib | +0.553 | +0.597 | +0.729 | +0.227 | +0.254 |
| HD 16068 | K3 II−III | +0.440 | +0.538 | +0.706 | +0.173 | +0.223 |
| HD 221246 | K3 III | +0.332 | +0.472 | +0.658 | +0.144 | +0.178 |
| HD 178208 | K3 III | +0.315 | +0.453 | +0.589 | +0.142 | ... |
| HD 35620 | K3 III Fe1 | +0.326 | +0.459 | +0.618 | +0.170 | +0.061 |
| HD 99998 | K3+ III Fe−0.5 | +0.347 | +0.526 | +0.744 | +0.195 | +0.144 |
| HD 114960 | K3.5 IIIb CN0.5 CH0.5 | +0.314 | +0.443 | +0.616 | +0.153 | +0.072 |
| HD 219134 | K3 V | +0.245 | +0.384 | +0.512 | +0.117 | +0.086 |
| HD 185622 | K4 Ib | +0.546 | +0.622 | +0.810 | +0.298 | ... |
| HD 201065 | K4 Ib−II | +0.444 | +0.563 | +0.753 | +0.223 | +0.181 |
| HD 207991 | K4− III | +0.384 | +0.533 | +0.771 | +0.202 | +0.058 |
| HD 45977 | K4 V | +0.192 | +0.351 | +0.480 | +0.105 | ... |
| HD 216946 | K5 Ib | +0.562 | +0.660 | +0.862 | +0.318 | +0.211 |
| HD 181596 | K5 III | +0.385 | +0.525 | +0.727 | +0.196 | +0.154 |
| HD 36003 | K5 V | +0.221 | +0.388 | +0.559 | +0.125 | +0.021 |
| HD 120477 | K5.5 III | +0.372 | +0.521 | +0.736 | +0.211 | +0.164 |
| HD 3346 | K6 IIIa | +0.364 | +0.529 | +0.772 | +0.230 | ... |
| HD 181475 | K7 IIa | +0.574 | +0.660 | +0.853 | +0.308 | ... |
| HD 194193 | K7 III | +0.401 | +0.549 | +0.811 | +0.225 | +0.106 |
| HD 237903 | K7 V | +0.271 | +0.430 | +0.608 | +0.134 | +0.112 |
| HD 201092 | K7 V | +0.212 | +0.374 | +0.554 | +0.151 | ... |
| HD 213893 | M0 IIIb | +0.390 | +0.526 | +0.759 | +0.200 | +0.086 |
| HD 19305 | M0 V | +0.287 | +0.437 | +0.632 | +0.182 | +0.074 |
| HD 236697 | M0.5 Ib | +0.579 | +0.673 | +0.839 | +0.304 | +0.273 |
| HD 209290 | M0.5 V | +0.336 | +0.476 | +0.629 | +0.217 | +0.195 |
| HD 339034 | M1 Ia | +0.983 | +0.906 | +0.922 | +0.491 | +0.516 |
| HD 14404 | M1− Iab−Ib | +0.613 | +0.666 | +0.804 | +0.303 | +0.337 |
| HD 39801 | M1−M2 Ia−Iab | +0.474 | +0.523 | +0.658 | +0.111 | +0.616 |
| HD 204724 | M1+ III | +0.394 | +0.491 | +0.713 | +0.253 | +0.085 |
| HD 42581 | M1 V | +0.332 | +0.456 | +0.606 | +0.210 | +0.199 |
| HD 35601 | M1.5 Iab−Ib | +0.638 | +0.717 | +0.863 | +0.362 | +0.253 |
| BD +60 265 | M1.5 Ib | +0.655 | +0.727 | +0.870 | +0.388 | +0.355 |
| HD 36395 | M1.5 V | +0.360 | +0.487 | +0.675 | +0.203 | +0.104 |
| HD 206936 | M2− Ia | +0.603 | +0.643 | +0.755 | +0.409 | +0.462 |
| HD 10465 | M2 Ib | +0.528 | +0.599 | +0.756 | +0.278 | +0.163 |
| HD 23475 | M2 II | +0.473 | +0.571 | +0.813 | +0.256 | ... |
| HD 120052 | M2 III | +0.427 | +0.589 | +0.841 | +0.271 | +0.087 |
| HD 95735 | M2 V | +0.339 | +0.460 | +0.512 | +0.216 | +0.310 |
| Gl 806 | M2 V | +0.340 | +0.458 | +0.562 | +0.187 | ... |
| HD 219734 | M2.5 III Ba0.5 | +0.446 | +0.570 | +0.809 | +0.245 | +0.084 |
| Gl 381 | M2.5 V | +0.398 | +0.500 | +0.550 | +0.242 | +0.263 |
| Gl 581 | M2.5 V | +0.406 | +0.486 | +0.523 | +0.280 | +0.301 |
| RW Cyg | M3 to M4 Ia−Iab | +0.839 | +0.820 | +0.982 | +0.448 | +0.356 |
| CD −31 4916 | M3 Iab−Ia | +0.637 | +0.700 | +0.851 | +0.342 | +0.395 |
| HD 14469 | M3−M4 Iab | +0.705 | +0.679 | +0.805 | +0.367 | +0.284 |
| HD 40239 | M3 IIb | +0.530 | +0.626 | +0.862 | +0.300 | +0.212 |
| HD 39045 | M3 III | +0.466 | +0.593 | +0.829 | +0.267 | +0.172 |
| Gl 388 | M3 V | +0.421 | +0.504 | +0.559 | +0.237 | +0.249 |
| HD 14488 | M3.5 Iab Fe−1 var? | +0.727 | +0.724 | +0.949 | +0.495 | +0.331 |
| HD 28487 | M3.5 III Ca−0.5 | +0.550 | +0.623 | +0.875 | +0.292 | +0.165 |
| Gl 273 | M3.5 V | +0.476 | +0.526 | +0.515 | +0.284 | +0.311 |
| HD 19058 | M4+ IIIa | +0.551 | +0.603 | +0.878 | +0.297 | +0.075 |
| HD 214665 | M4+ III | +0.694 | +0.726 | +0.954 | +0.335 | +0.031 |
| HD 4408 | M4 III | +0.521 | +0.598 | +0.856 | +0.297 | +0.027 |
| HD 27598 | M4− III | +0.500 | +0.572 | +0.820 | +0.272 | +0.165 |
| Gl 213 | M4 V | +0.500 | +0.523 | +0.464 | +0.281 | +0.368 |
| Gl 299 | M4 V | +0.485 | +0.525 | +0.411 | +0.310 | +0.464 |
| HD 204585 | M4.5 IIIa | +0.621 | +0.590 | +0.780 | +0.234 | ... |
| Gl 268AB | M4.5 V | +0.552 | +0.570 | +0.535 | +0.311 | +0.392 |
| HD 156014 | M5 Ib−II | +0.647 | +0.517 | +0.614 | +0.097 | +0.188 |
| HD 175865 | M5 III | +0.648 | +0.601 | +0.798 | +0.229 | ... |
| Gl 51 | M5 V | +0.601 | +0.612 | +0.538 | +0.331 | +0.335 |
| Gl 866ABC | M5 V | +0.727 | +0.677 | +0.556 | +0.370 | +0.457 |
| HD 94705 | M5.5 III: | +0.755 | +0.643 | +0.827 | +0.333 | +0.175 |
| HD 196610 | M6 III | +0.851 | +0.629 | +0.789 | +0.284 | −0.091 |
| HD 18191 | M6− III: | +0.794 | +0.669 | +0.870 | +0.319 | −0.012 |
| Gl 406 | M6 V | +0.824 | +0.719 | +0.563 | +0.415 | +0.513 |
| GJ 1111 | M6.5 V | +0.841 | +0.726 | +0.524 | +0.422 | +0.516 |
| HD 14386 | M5e−M9e III | +1.213 | +0.654 | +0.519 | +0.519 | +0.600 |
| HD 108849 | M7− III: | +1.151 | +0.811 | +0.814 | +0.414 | +0.204 |
| HD 207076 | M7− III: | +1.007 | +0.649 | +0.697 | +0.282 | +0.498 |
| Gl 644C | M7 V | +0.861 | +0.745 | +0.505 | +0.438 | +0.544 |
| MY Cep | M7−M7.5 I | +1.469 | +1.246 | +1.315 | +0.814 | +0.919 |
| HD 69243 | M6e−M9e III | +1.533 | +1.258 | +0.738 | +0.611 | +0.707 |
| BRI B2339 − 0447 | M7 − 8 III | +0.701 | +0.589 | +0.819 | +0.498 | +0.590 |
| IRAS 01037+1219 | M8 III | +2.767 | +2.545 | +2.244 | +1.787 | +2.288 |
| Gl 752B | M8 V | +1.039 | +0.824 | +0.543 | +0.487 | +0.590 |
| LP 412 − 31 | M8 V | +1.030 | +0.893 | +0.630 | +0.486 | +0.612 |
| IRAS 21284 − 0747 | M8 − 9 III | +1.536 | +1.092 | +0.693 | +0.673 | +0.822 |
| IRAS 14436 − 0703 | M8 − 9 III | +1.437 | +0.925 | +0.575 | +0.601 | ... |
| IRAS 14303 − 1042 | M8 − 9 III | +1.251 | +0.761 | +0.586 | +0.657 | ... |
| IRAS 15060+0947 | M9 III | +1.350 | +1.011 | +1.162 | +1.206 | ... |
| BRI B1219 − 1336 | M9 III | +1.273 | +0.843 | +0.602 | +0.577 | ... |
| DENIS−P J104814.7 − 395606.1 | M9 V | +1.101 | +0.879 | +0.505 | +0.481 | +0.681 |
| LP 944 − 20 | M9 V | +1.253 | +0.994 | +0.592 | +0.536 | +0.750 |
| LHS 2065 | M9 V | +1.209 | +1.004 | +0.698 | +0.569 | ... |
| LHS 2924 | M9 V | +1.209 | +0.999 | +0.657 | +0.536 | ... |
| BRI B0021 − 0214 | M9.5 V | +1.244 | +1.085 | +0.698 | +0.591 | +0.661 |
| IRAS 14086 − 0703 | M10+ III | +2.219 | +2.128 | +1.885 | +2.054 | ... |
| HD 142143 | M6.5S to M7S III: | +0.975 | +0.787 | +0.876 | +0.431 | +0.256 |
| BD +44 2267 | S2.5 Zr 2 | +0.456 | +0.566 | +0.762 | +0.242 | +0.245 |
| HD 64332 | S4.5 Zr 2 Ti 4 | +0.488 | +0.596 | +0.817 | +0.285 | +0.219 |
| HD 44544 | SC5.5 Zr 0.5 | +0.812 | +0.823 | +1.031 | +0.414 | +0.494 |
| HD 62164 | S5−S6 Zr 3 to 4 Ti 0 | +0.661 | +0.742 | +0.972 | +0.409 | +0.315 |
| HD 76846 | C−R2+ IIIa: C2 2.5 | +0.374 | +0.370 | +0.475 | +0.175 | +0.240 |
| HD 31996 | C7,6e(N4) | +0.649 | +0.947 | +1.279 | +1.187 | +1.152 |
| HD 44984 | C−N4 C2 3.5 | +0.638 | +0.580 | +0.901 | +0.437 | +0.403 |
| HD 76221 | C−N 4.5 C2 5.5 MS 3 | +0.620 | +0.657 | +1.008 | +0.645 | +0.593 |
| HD 92055 | C−N4.5 C2 4.5 | +0.651 | +0.655 | +0.989 | +0.480 | +0.493 |
| HD 70138 | C−J4.5 IIIa: C2 6 j 6 | +0.657 | +0.482 | +0.893 | +0.491 | +0.622 |
| HD 48664 | C−N5 C2 6 | +0.745 | +0.725 | +1.067 | +0.646 | +0.643 |
| HD 57160 | C−J5− C2 5− j 4 | +0.627 | +0.646 | +0.999 | +0.582 | +0.625 |
The trends in the colors of the stars as a function of spectral type in the J − H versus H − K diagram are very similar to those presented by Bessell & Brett (1988, Figure 5) and Reid & Hawley (2005, Figure 2.22), with the slight difference that our photometry is in the NIR-MKO system. Since our photometric errors are small (at most a few percent, see Section 2.3), the scatter in these plots is due to real differences in stellar colors produced by variations in metallicity, reddening, etc. The most noticeable feature of the JHK color–color diagram is the bifurcation between M dwarfs and stars of higher luminosity classes. Stars of all luminosity classes initially show a steep rise in J − H with later spectral type but starting at a spectral type of ∼M0, the J − H colors of the dwarfs become bluer while that of the M giants and supergiants continue to become redder (Lee 1970; Glass 1975; Frogel et al. 1978). The J and H bands probe different layers (and thus different temperatures) in an atmosphere because H−, the dominant continuum opacity source at these wavelengths, has a minimum at ∼1.6 μm. The turnover in the J − H colors of the M dwarfs is therefore due to a change in the adiabatic temperature gradient as hydrogen is increasingly converted into H2 in the high pressure (relative to giants) atmospheres of M dwarfs (Mould 1976). The J − H colors of the M dwarfs continue to become bluer with the onset of H2O absorption that suppresses the H- and K-band fluxes but eventually flatten out before becoming redder again for late-type M dwarfs and L dwarfs as the peak of the Planck function shifts farther into the NIR.
We note that the locus of late-M giants (Lb, SRb, and M variables; see Table 2) in the JHK color–color diagram appears to turn back down toward the location of late-type M and L dwarfs (see Figure 37). Figure 39 shows the spectral behavior of a selection of late-type M giants along the locus of decreasing J − H and increasing H − K color. The most distinctive features in these spectra are the broad H2O absorption features centered at 1.4 μm and 1.9 μm. H2O absorption is observed no earlier than M6 III (see also Figure 8) and then increases in strength with later spectral types, in agreement with the trends first observed by Frogel (1971) and Hyland (1974). The turnover in J − H is therefore a result of increasing H2O line absorption which suppresses the H- and K-band fluxes more than the J-band flux. Models of Mira variables (Bessell et al. 1989, 1996) can reproduce the observed turnover in J − H. In these models pulsation produces extended atmospheres in which water can form in dense cool (⩽103 K) layers formed behind periodically outward-running shocks.
Other intrinsically red stars include late-type supergiants, carbon and S stars. The red colors are due to the cool continuum temperatures, together with molecular line blanketing from CO and CN in supergiants and from CN and C2 in carbon stars.
One of the observable consequences of mass loss in TPAGB stars is an approximately linear locus in the JHK color–color diagram reflecting the effects of differential extinction and dust temperature in models of circumstellar shells (e.g., Lewis 2006). Less dusty Mira variables are located at the blue end of this locus at J − H ∼ 0.8, H − K ∼ 0.6, while the more deeply embedded OH/IR stars (optically obscured stars with 1612 MHz OH line emission) are located at the red end. The two OH/IR stars observed in our sample are located at J − H ∼ 2, H − K ∼ 2 (see Figure 38).
Library spectra can be used to synthesize other colors and experiment with other photometric systems. As an example, the Y − J versus J − H color–color diagram shown in Figure 40 illustrates the advantage of using the Y band in combination with the standard JHK bands when trying to identify T dwarfs (see also Hillenbrand et al. 2002; Hewett et al. 2006) compared to using JHK colors alone (see Figure 37). The J − H color can be used as an indicator of T dwarf spectral types and is accurate to within about one subtype. For example, the UKIRT Infrared Deep Sky Survey (UKIDSS) is using YJH photometry in a wide area survey for T dwarfs and cooler objects (Pinfield et al. 2008). Note also the bifurcation between M dwarfs and stars of higher luminosity, which is also seen in the JHK plot. Starting at M0 V, dwarfs initially become bluer in J − H with constant Y − J constant, due to the change in adiabatic temperature gradient (Figure 40). This trend ends at about M4 V at which point dwarfs become redder in Y − J and J − H with decreasing effective temperature. The effect of increasing H2O absorption in these late-type dwarfs is to decrease the amount of J − H reddening compared with the locus of higher luminosity stars. Late-type M giants have similar colors to late-type dwarfs since both have H2O absorption in the NIR.
4.3. Notes on Individual Objects
Ten of the 212 stars in the library have spectra and/or J − H versus H − K colors that are different from those expected based on their spectral type. Five of these stars are supergiants displaying emission lines and with redder than normal continua that cannot be explained by standard interstellar reddening (reddening not in the direction of the extinction vector). As explained below, most of these stars are probably PAGB stars. Three of the unusual stars are emission-line Mira variables (TPAGB stars). Of the two remaining unusual stars, one is an M subdwarf misclassified as an M dwarf and the other is an F dwarf with weak emission in some metal lines.
Unusual objects are circled in the J − H versus H − K diagram (see Figure 37):
HD 26015 is classified as F3 V by Gray et al. (2001). The spectrum is normal up to 2.22 μm but at longer wavelengths some metal lines go into weak emission (Ca i doublet at 2.263 and 2.267 μm, Mg i at 2.280 μm, Na i at 2.339 μm, and Mg i at 3.867 μm). The continuum is also slightly bluer than normal for a spectral type of F3V. The star is classified as variable (of unspecified type) in the GCVS and is slightly metal rich ([Fe/H] = 0.2, average from SIMBAD).
HD 179821 is classified as G4 O–Ia by Keenan & McNeil (1989). Strong emission in the Na i doublet at 2.205 and 2.209 μm is seen together with very strong Pfund series absorption longward of the series limit at about 2.33 μm. The expected first CO overtone bands in the K band are absent. From its location in the JHK color–color diagram, the star has a significant NIR excess. The star is classified as a semiregular variable giant or supergiant (type SRd) in the GCVS. Optical Hubble Space Telescope (HST) images of HD 179821 reveal a bright star embedded in faint extended nebulosity (Ueta et al. 2000). Kipper (2008) reviews observations of HD 179821 some of which are consistent with an intermediate-mass PAGB star, while others point to a high-mass post-red-supergiant star.
HD 6474 is classified as G4 Ia by Keenan & McNeil (1989). The spectral continuum is redder than normal, and the JHK colors indicate a NIR excess. Spectral features in the K band appear subdued probably due to veiling and Si i at 3.745 μm is in emission. The star is classified as a semiregular variable (type SRd) in the GCVS and as a UU Her-type variable by Zsoldos (1993). Szczerba et al. (2007) classify UU Her-type variables with NIR excess due to circumstellar dust as probable PAGB stars.
HD 333385 (BD + 29° 3865) is classified as G7 Ia by Keenan & McNeil (1989). The star is classified as a slow irregular variable (type L) in the GCVS. The spectrum is clearly unusual showing a number of metal lines in emission, particularly in the K band, where the Na i doublet at 2.205 and 2.209 μm is strong. The first CO overtone bands in the K band appear sharper than those in other late-type G supergiants. Si i at 3.745 μm is in emission. The JHK colors indicate a large NIR excess. Using high-dispersion optical echelle spectra, Klochkova et al. (2000) conclude that HD 333385 is probably a PAGB star.
HD 165782 is classified as K0 Ia by Keenan & McNeil (1989). The spectrum shows weak absorption features in the K band probably due to veiling, and the Na i doublet at 2.205 and 2.209 μm is in emission. The first CO overtone bands in the K band appear sharp and Si i at 3.745 μm is in emission. The JHK colors indicate a NIR excess. The star is classified as a semiregular variable (type SRd) in the GCVS. An OH maser is reported by Nyman et al. (1998), and Omont et al. (1993) classify HD 165782 as a PAGB star.
HD 212466 is classified as K2 O–Ia by Keenan & McNeil (1989). The spectrum shows SiO in emission at 4.00, 4.04, and 4.08 μm, and the first CO overtone bands in the K band appear sharp. The JHK colors indicate a large NIR excess. The star is classified as a semiregular variable (type SRd) in the GCVS. A Si emission feature at 10 μm is cited as evidence of mass loss by Sylvester et al. (1998).
Gl 299 is classified as M4 V by Henry et al. (1994). However, its location below the locus of M dwarfs in the J − H versus H − K plot is more consistent with an M subdwarf (Bessell & Brett 1988, Figure A3). This is confirmed by its spectrum that shows weak CO overtone absorption at 2.29 μm, a weak Na i doublet at 2.205 and 2.209 μm, and weak K i at 1.516 μm, compared with a normal M4 V (e.g., Cushing & Vacca 2006).
HD 14386 (Mira) is classified as M5e-M9e III and as a Mira variable (type M) in the GCVS. This archetypal variable star was observed on three occasions. On 2003 January 14 the emission line due to Paβ (1.28 μm, EW −0.4 Å) was detected, on 2003 September 20 emission lines due to Paγ (1.094 μm, EW −0.9 Å) and Paβ (1.282 μm, EW −0.7 Å) were detected, and on 2003 November 6 the emission line due to Na i (1.269 μm, EW −1.0 Å) was detected. (Nondetections of these lines are roughly EW >−0.2 Å.) Mira-type variables can emit in a variety of metal and hydrogen lines, probably originating in atmospheric shock waves resulting from pulsation (e.g., Richter & Wood 2001). The lines are known to come and go depending upon cycle and phase (e.g., Lançon & Wood 2000, in the NIR).
BRI B2339 − 0447 is classified as M7-8 III by Kirkpatrick et al. (1997) and as a Mira variable (type M) in the GCVS. The spectrum shows Paγ (1.0944 μm, EW 1.2 Å), Paβ (1.282 μm, EW 0.8 Å), and Brγ (2.166 μm, EW 0.5 Å) in emission. Paδ (1.005 μm) in emission was also detected but blended with a TiO band head.
IRAS 1403 − 1042 is classified as M8–9 III by Kirkpatrick et al. (1997) and as a Mira variable (type M) in the GCVS. The spectrum shows Paγ (1.094 μm, EW 1.9 Å) and Paβ (1.282 μm, EW 4.8 Å) in emission (see Figure 37). Paδ (1.005 μm) in emission was also detected but blended with a TiO band head.
5. SUMMARY
We have constructed a medium resolution (R ∼ 2000) near-infrared (0.8–5 μm) spectral library of 210 cool stars. The stars all have well established MK classifications and have near-solar metallicities. The sample covers F, G, K, and M stars with luminosity classes between I and V, and includes some AGB, carbon, and S stars. Sample selection, data reduction, and data calibration are carefully described. The continuum shape of the spectra is measured to an accuracy of a few percent, and the spectra are absolutely flux calibrated using 2MASS photometry. Synthesized color–color diagrams are constructed from the spectra and their use demonstrated. Spectral features are described and detailed lists of atomic and molecular features are tabulated. Several unusual stars in the sample are identified and described. The library is available in digital form from the IRTF Web site.
Observations for the IRTF Spectral Library required a significant investment in telescope time and the authors would like to thank IRTF Director, Alan Tokunaga, and the IRTF TAC for their support. Observing was ably assisted by telescope operators Bill Golisch, Dave Griep, and Paul Sears. We would also like to thank the IRTF day crew and engineering staff for excellent maintenance of the telescope and instrumentation. Natasha Förster-Schreiber helped us with sample selection during the early stages of the project. J.T.R. would like to thank Katelyn Allers for providing observations of five late-type M giants. M.C.C. acknowledges financial support from the IRTF and by the National Aeronautics and Space Administration through the Spitzer Space Telescope Fellowship Program through a contract issued by the Jet Propulsion Laboratory, California Institute of Technology, under a contract with NASA. W.D.V. and M.C.C acknowledge financial support from IRTF during several trips to Honolulu. This publication makes use of data from the Two Micron All Sky Survey, which is a joint project of the University of Massachusetts and the Infrared Processing and Analysis Center and is funded by NASA and the National Science Foundation. This research has made use of the SIMBAD database, operated at CDS, Strasbourg, France; NASA's Astrophysics Data System Bibliographic Services; and the SpeX Prism Spectral Libraries, maintained by Adam Burgasser.10 We thank the anonymous referee for a thorough reading of the manuscript and insightful suggestions for improving it.
Facilities: IRTF (SpeX)
APPENDIX: SPECTRAL SEQUENCES
More complete spectral sequences are plotted in this section: F stars (bands I, Y, J, H, K, and L') in Figures 41–58; G stars (bands I, Y, J, H, K, and L') in Figures 59–76; K stars (bands I, Y, J, H, K, and L') in Figures 77–94; and M stars (bands I, Y, J, H, K, and L') in Figures 95–112. For feature identifications see the partial spectral sequences plotted in Figures 7–34.
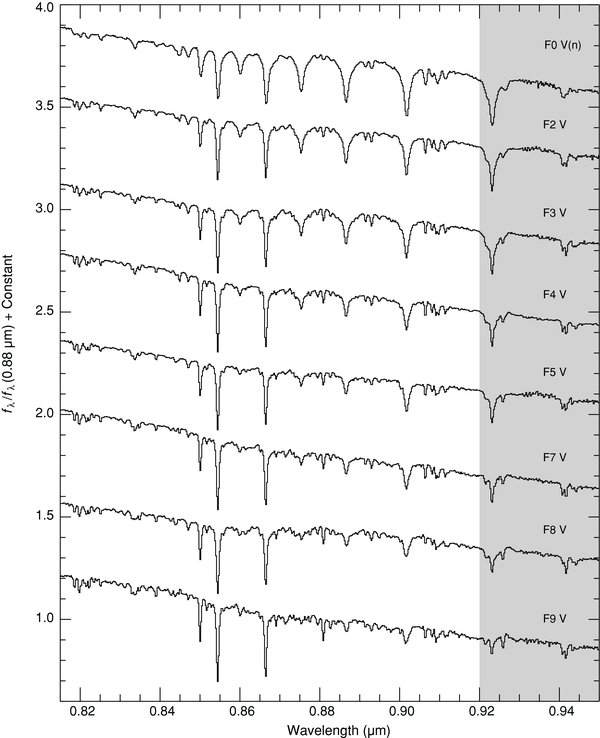
Figure 41. Sequence of F dwarf stars plotted over the I band (0.82–0.95 μm). The spectra are of HD 108519 F0 V(n), HD 113139 (F2 V), HD 26015 (F3 V), HD 87822 (F4 V), HD 218804 (F5 V), HD 126660 (F7 V), HD 27393 (F8 V), and HD 176051 (F9 V). The spectra have been normalized to unity at 0.88 μm and offset by constants.
Download figure:
Standard image High-resolution image
Figure 42. Sequence of F giant stars plotted over the I band (0.82–0.95 μm). The spectra are of HD 89025 (F0 IIIa), HD 40535 (F2 III–IV), HD 21770 (F4 III), HD 17918 (F5 III), HD 160365 (F6 III–IV), HD 124850 (F7 III), HD 220657 (F8 III), and HD 6903 (F9 IIIa). The spectra have been normalized to unity at 0.88 μm and offset by constants.
Download figure:
Standard image High-resolution image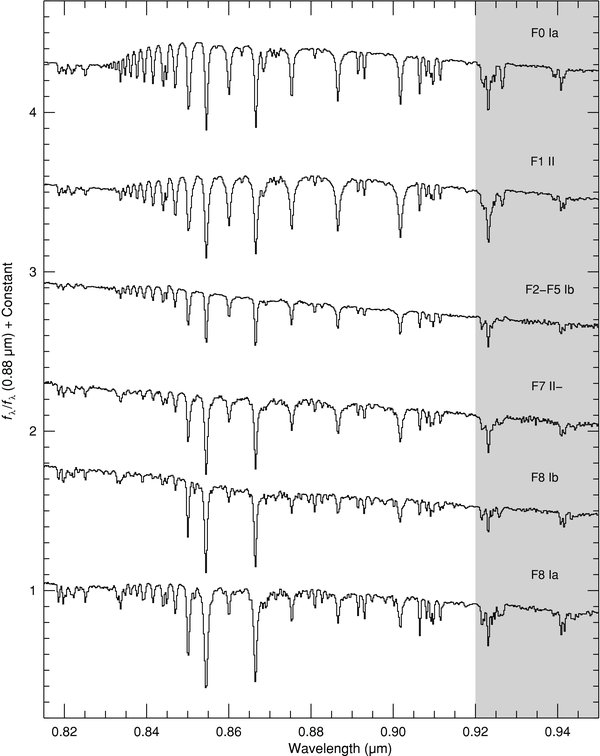
Figure 43. Sequence of F supergiant stars plotted over the I band (0.82–0.95 μm). The spectra are of HD 7927 (F0 Ia), HD 173638 (F1 II), BD +38 2803 (F2–F5 Ib), HD 201078 (F7 II−), HD 51956 (F8 Ib) and HD 190323 (F8 Ia). The spectra have been normalized to unity at 0.88 μm and offset by constants.
Download figure:
Standard image High-resolution image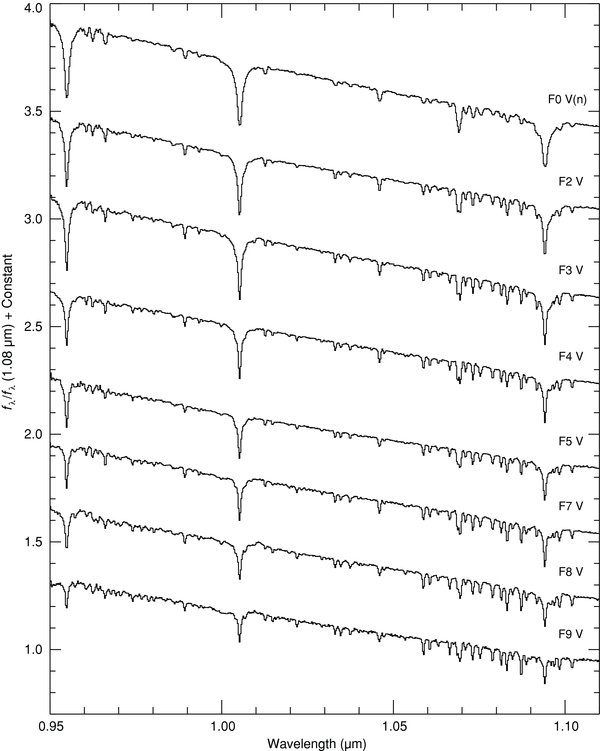
Figure 44. Sequence of F dwarf stars plotted over the Y band (0.95–1.10 μm). The spectra are of HD 108519 F0 V(n), HD 113139 (F2 V), HD 26015 (F3 V), HD 87822 (F4 V), HD 218804 (F5 V), HD 126660 (F7 V), HD 27393 (F8 V), and HD 176051 (F9 V). The spectra have been normalized to unity at 1.08 μm and offset by constants.
Download figure:
Standard image High-resolution image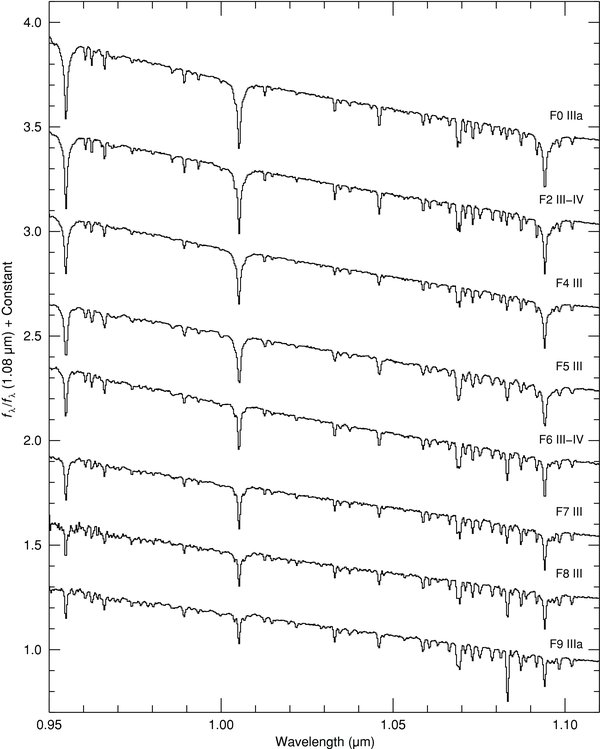
Figure 45. Sequence of F giant stars plotted over the Y band (0.95–1.10 μm). The spectra are of HD 89025 (F0 IIIa), HD 40535 (F2 III–IV), HD 21770 (F4 III), HD 17918 (F5 III), HD 160365 (F6 III–IV), HD 124850 (F7 III), HD 220657 (F8 III), and HD 6903 (F9 IIIa). The spectra have been normalized to unity at 1.08 μm and offset by constants.
Download figure:
Standard image High-resolution image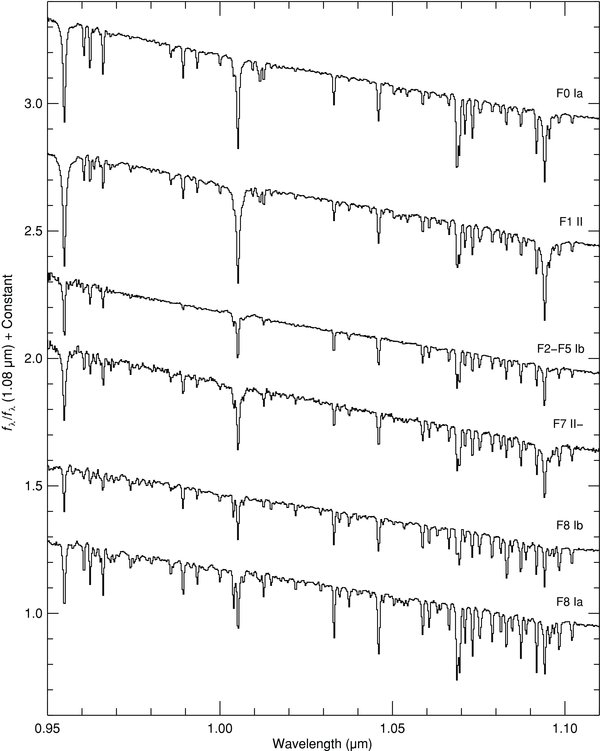
Figure 46. Sequence of F supergiant stars plotted over the Y band (0.95–1.10 μm). The spectra are of HD 7927 (F0 Ia), HD 173638 (F1 II), BD +38 2803 (F2–F5 Ib), HD 51956 (F6 IbII), HD 201078 (F7 II–), and HD 190323 (F8 Ia). The spectra have been normalized to unity at 1.08 μm and offset by constants.
Download figure:
Standard image High-resolution image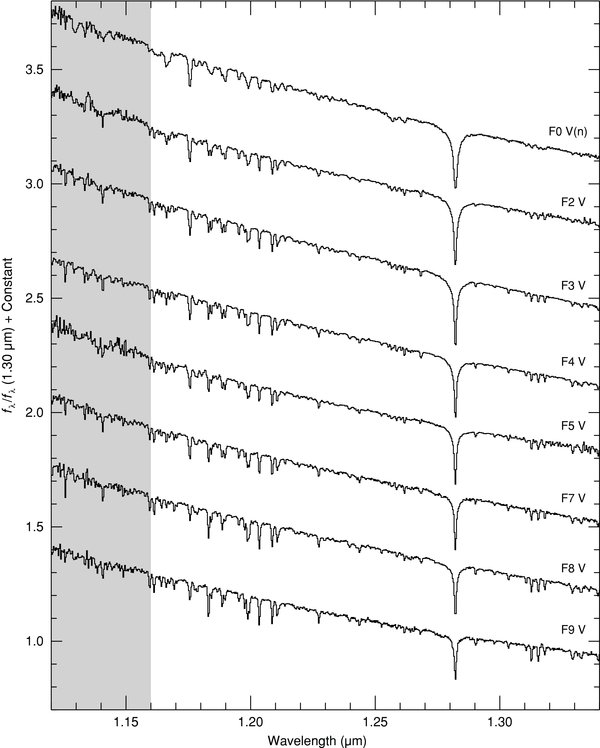
Figure 47. Sequence of F dwarf stars plotted over the J band (1.12–1.34 μm). The spectra are of HD 108519 F0 V(n), HD 113139 (F2 V), HD 26015 (F3 V), HD 87822 (F4 V), HD 218804 (F5 V), HD 126660 (F7 V), HD 27393 (F8 V), and HD 176051 (F9 V). The spectra have been normalized to unity at 1.30 μm and offset by constants.
Download figure:
Standard image High-resolution image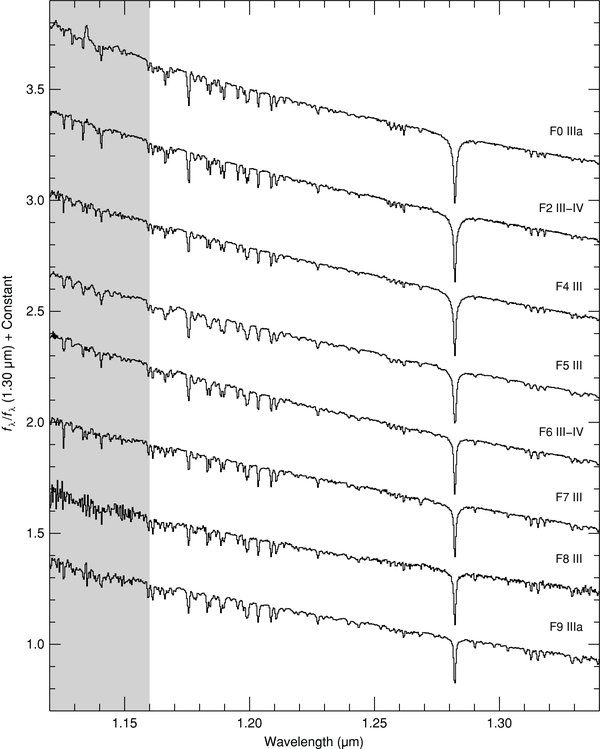
Figure 48. Sequence of F giant stars plotted over the J band (1.12–1.34 μm). The spectra are of HD 89025 (F0 IIIa), HD 40535 (F2 III–IV), HD 21770 (F4 III), HD 17918 (F5 III), HD 160365 (F6 III–IV), HD 124850 (F7 III), HD 220657 (F8 III), HD 6903 (F9 IIIa). The spectra have been normalized to unity at 1.30 μm and offset by constants.
Download figure:
Standard image High-resolution image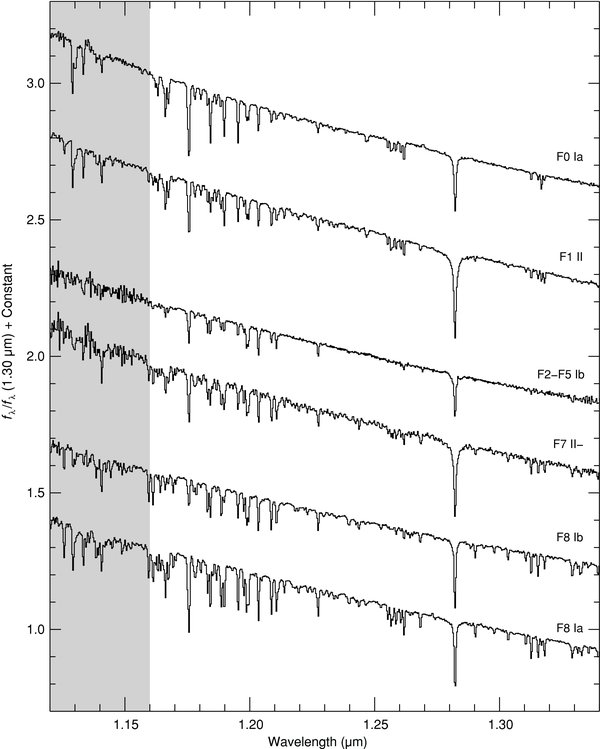
Figure 49. Sequence of F supergiant stars plotted over the J band (1.12–1.34 μm). The spectra are of HD 7927 (F0 Ia), HD 173638 (F1 II), BD +38 2803 (F2–F5 Ib), HD 201078 (F7 II−), HD 51956 (F8 Ib) and HD 190323 (F8 Ia). The spectra have been normalized to unity at 1.30 μm and offset by constants.
Download figure:
Standard image High-resolution image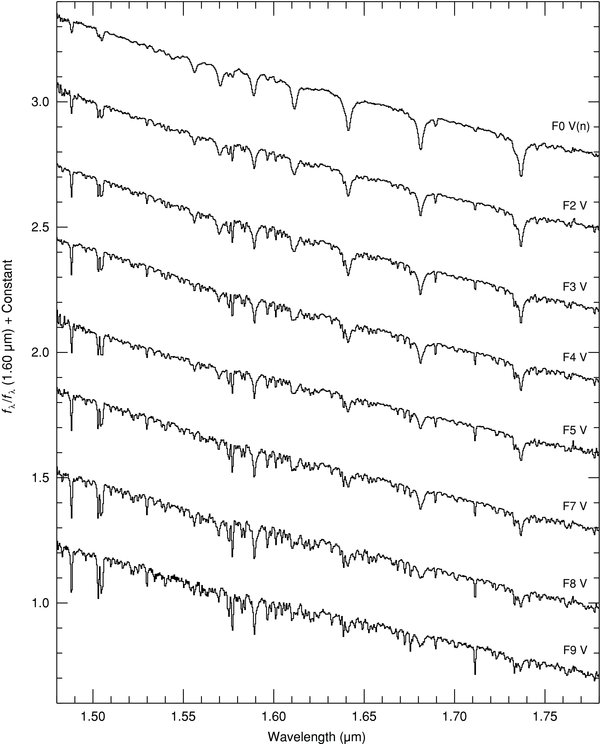
Figure 50. Sequence of F dwarf stars plotted over the H band (1.78–1.78 μm). The spectra are of HD 108519 F0 V(n), HD 113139 (F2 V), HD 26015 (F3 V), HD 87822 (F4 V), HD 218804 (F5 V), HD 126660 (F7 V), HD 27393 (F8 V), and HD 176051 (F9 V). The spectra have been normalized to unity at 1.60 μm and offset by constants.
Download figure:
Standard image High-resolution image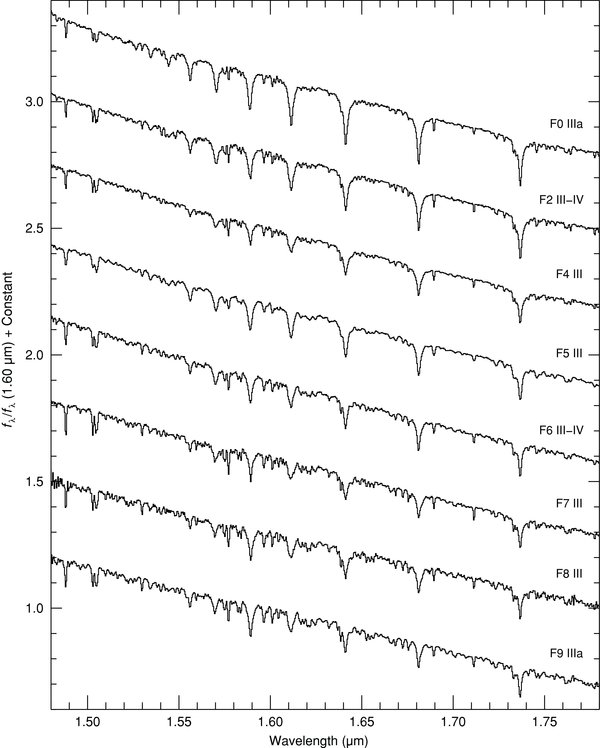
Figure 51. Sequence of F giant stars plotted over the H band (1.48–1.78 μm). The spectra are of HD 89025 (F0 IIIa), HD 40535 (F2 III–IV), HD 21770 (F4 III), HD 17918 (F5 III), HD 160365 (F6 III–IV), HD 124850 (F7 III), HD 220657 (F8 III), HD 6903 (F9 IIIa). The spectra have been normalized to unity at 1.60 μm and offset by constants.
Download figure:
Standard image High-resolution image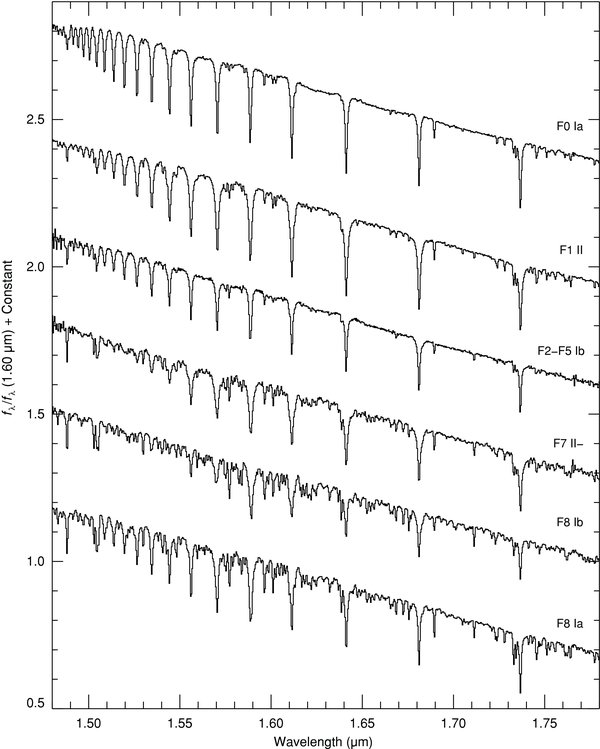
Figure 52. Sequence of F supergiant stars plotted over the H band (1.48–1.78 μm). The spectra are of HD 7927 (F0 Ia), HD 173638 (F1 II), BD +38 2803 (F2–F5 Ib), HD 51956 (F6 IbII), HD 201078 (F7 II–), and HD 190323 (F8 Ia). The spectra have been normalized to unity at 1.60 μm and offset by constants.
Download figure:
Standard image High-resolution image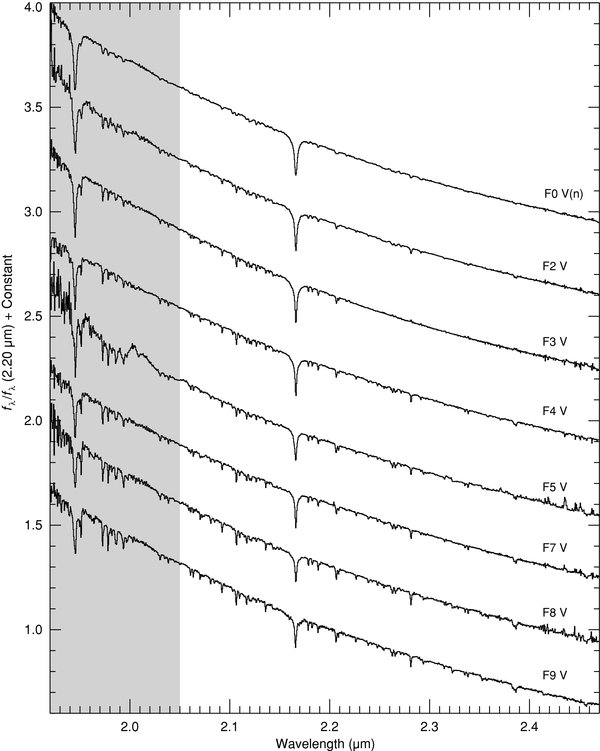
Figure 53. Sequence of F dwarf stars plotted over the K band (1.92–2.5 μm). The spectra are of HD 108519 F0 V(n), HD 113139 (F2 V), HD 26015 (F3 V), HD 87822 (F4 V), HD 218804 (F5 V), HD 126660 (F7 V), HD 27393 (F8 V), and HD 176051 (F9 V). The spectra have been normalized to unity at 2.20 μm and offset by constants.
Download figure:
Standard image High-resolution image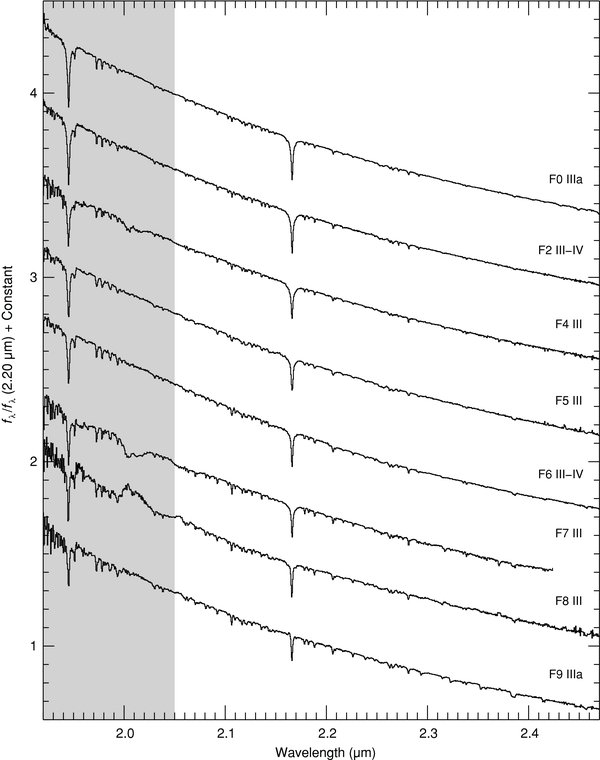
Figure 54. Sequence of F giant stars plotted over the K band (1.92–2.5 μm). The spectra are of HD 89025 (F0 IIIa), HD 40535 (F2 III–IV), HD 21770 (F4 III), HD 17918 (F5 III), HD 160365 (F6 III–IV), HD 124850 (F7 III), HD 220657 (F8 III), HD 6903 (F9 IIIa). The spectra have been normalized to unity at 2.20 μm and offset by constants. Note the relatively poor correction of telluric CO2 at ∼2.02 μm in the F7 III and F8 III stars (see Section 2.2).
Download figure:
Standard image High-resolution image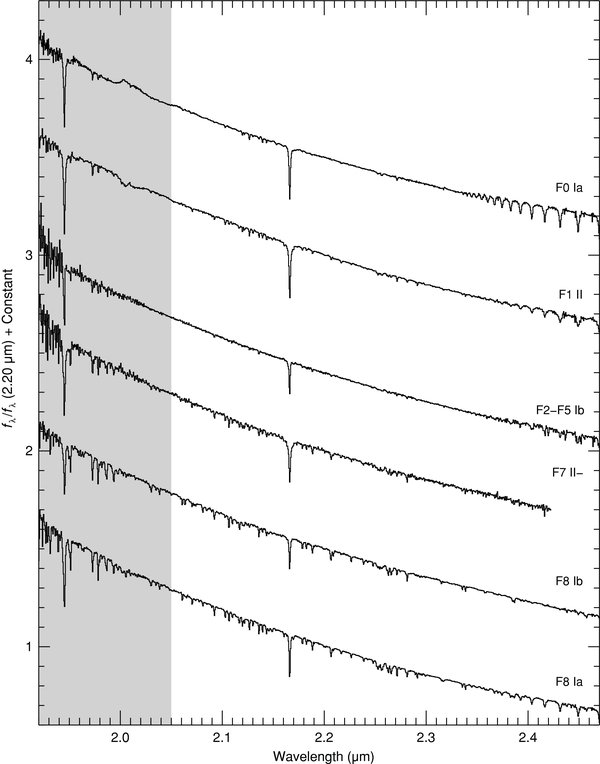
Figure 55. Sequence of F supergiant stars plotted over the K band (1.92–2.5 μm). The spectra are of HD 7927 (F0 Ia), HD 173638 (F1 II), BD +38 2803 (F2–F5 Ib), HD 51956 (F6 IbII), HD 201078 (F7 II–), and HD 190323 (F8 Ia). The spectra have been normalized to unity at 2.20 μm and offset by constants.
Download figure:
Standard image High-resolution image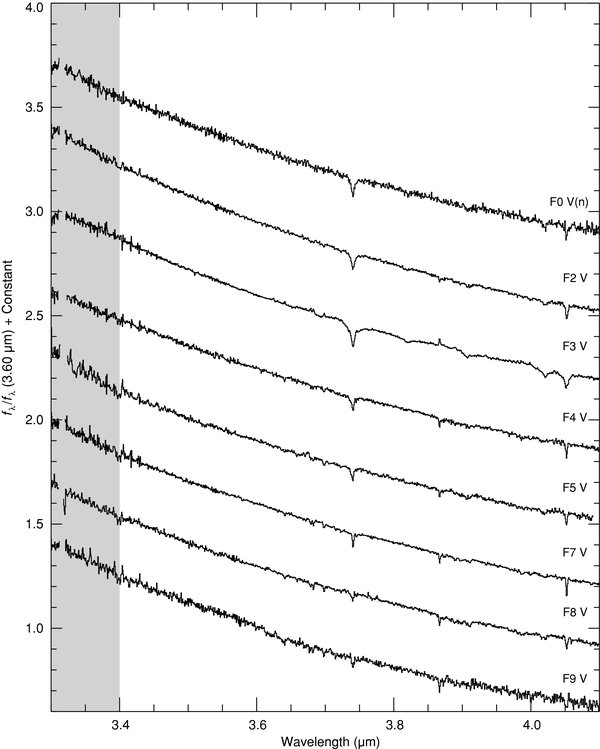
Figure 56. Sequence of F dwarf stars plotted over the L' band (3.3–4.1 μm). The spectra are of HD 108519 F0 V(n), HD 113139 (F2 V), HD 26015 (F3 V), HD 87822 (F4 V), HD 218804 (F5 V), HD 126660 (F7 V), HD 27393 (F8 V), and HD 176051 (F9 V). The spectra have been normalized to unity at 3.6 μm and offset by constants.
Download figure:
Standard image High-resolution image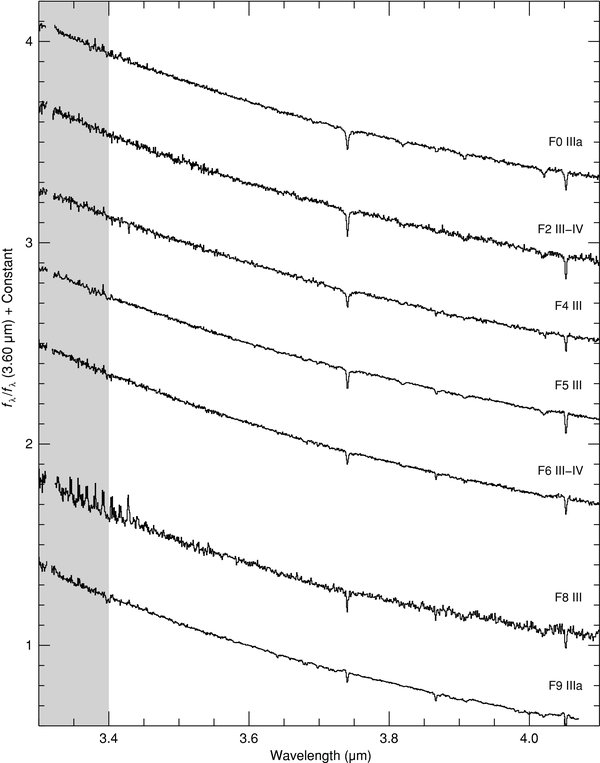
Figure 57. Sequence of F giant stars plotted over the L' band (3.3–4.1 μm). The spectra are of HD 89025 (F0 IIIa), HD 40535 (F2 III–IV), HD 21770 (F4 III), HD 17918 (F5 III), HD 160365 (F6 III–IV), HD 124850 (F7 III), HD 220657 (F8 III), and HD 6903 (F9 IIIa). The spectra have been normalized to unity at 3.6 μm and offset by constants.
Download figure:
Standard image High-resolution image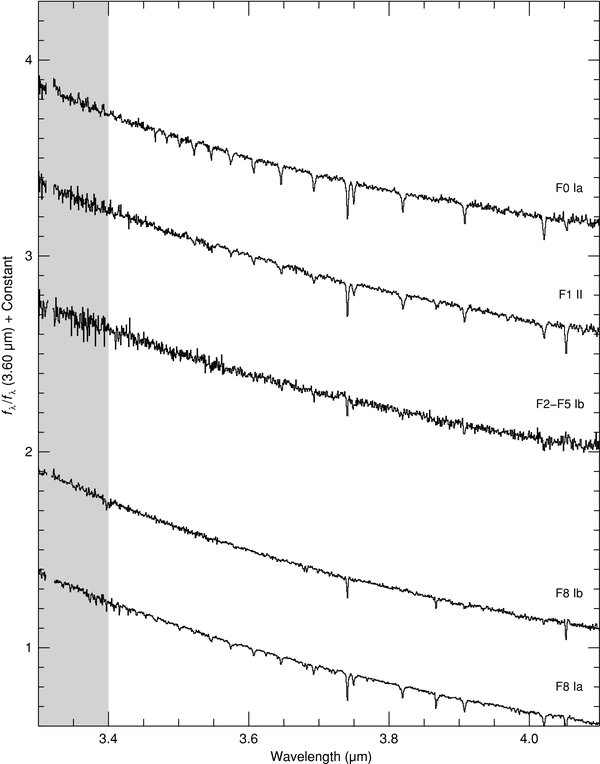
Figure 58. Sequence of F supergiant stars plotted over the L' band (1.92–2.5 μm). The spectra are of HD 7927 (F0 Ia), HD 173638 (F1 II), BD +38 2803 (F2–F5 Ib), HD 51956 (F6 IbII), HD 201078 (F7 II–), and HD 190323 (F8 Ia). The spectra have been normalized to unity at 3.6 μm and offset by constants.
Download figure:
Standard image High-resolution image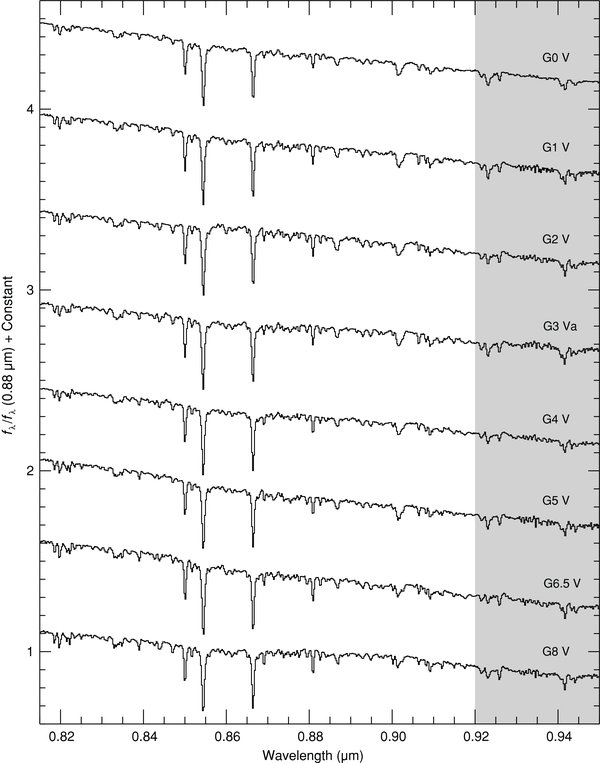
Figure 59. Sequence of G dwarf stars plotted over the I band (0.82–0.95 μm). The spectra are of HD 109358 (G0 V), HD 10307 (G1 V), HD 76151 (G2 V), HD 10697 (G3 Va), HD 214850 (G4 V), HD 165185 (G5 V), HD 115617 (G6.5 V), and HD 101501 (G8 V). The spectra have been normalized to unity at 0.88 μm and offset by constants.
Download figure:
Standard image High-resolution image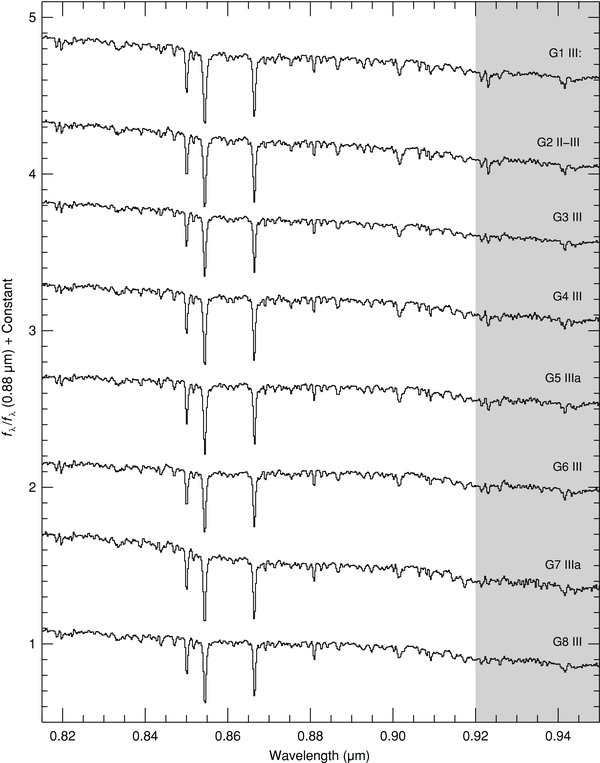
Figure 60. Sequence of G giant stars plotted over the I band (0.82–0.95 μm). The spectra are of HD 21018 (G1 III:CH–1:), HD 219477 (G2 II–III), HD 88639 (G3 IIIb Fe–1), HD 108477 (G4 III), HD 193896 (G5 IIIa), HD 27277 (G6 III), HD 182694 (G7 IIIa), and HD 135722 (G8 III Fe–1). The spectra have been normalized to unity at 0.88 μm and offset by constants.
Download figure:
Standard image High-resolution image
Figure 61. Sequence of G supergiant stars plotted over the I band (0.82–0.95 μm). The spectra are of HD 185018 (G0 Ib–II), HD 74395 (G1 Ib), HD 3421 (G2 Ib–II), HD 192713 (G3 Ib–II Wk H&K comp?), HD 190113 (G5 Ib), HD 202314 (G6 Ib–IIa Ca1 B0.5), and HD 208606 (G8 Ib). The spectra have been normalized to unity at 0.88 μm and offset by constants.
Download figure:
Standard image High-resolution image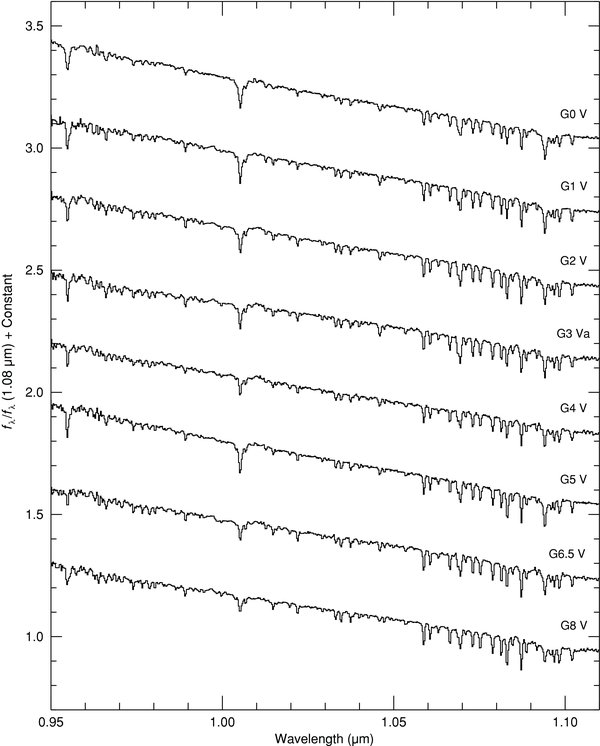
Figure 62. Sequence of G dwarf stars plotted over the Y band (0.95–1.10 μm). The spectra are of HD 109358 (G0 V), HD 10307 (G1 V), HD 76151 (G2 V), HD 10697 (G3 Va), HD 214850 (G4 V), HD 165185 (G5 V), HD 115617 (G6.5 V), and HD 101501 (G8 V). The spectra have been normalized to unity at 1.08 μm and offset by constants.
Download figure:
Standard image High-resolution image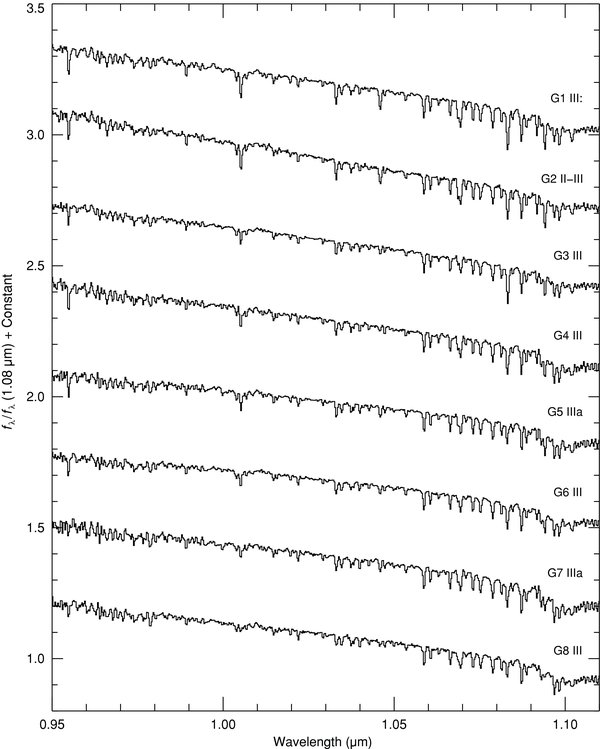
Figure 63. Sequence of G giant stars plotted over the Y band (0.95–1.10 μm). The spectra are of HD 21018 (G1 III:CH–1:), HD 219477 (G2 II–III), HD 88639 (G3b III Fe–1), HD 108477 (G4 III), HD 193896 (G5 IIIa), HD 27277 (G6 III), HD 182694 (G7 IIIa), and HD 135722 (G8 III Fe–1). The spectra have been normalized to unity at 1.08 μm and offset by constants.
Download figure:
Standard image High-resolution image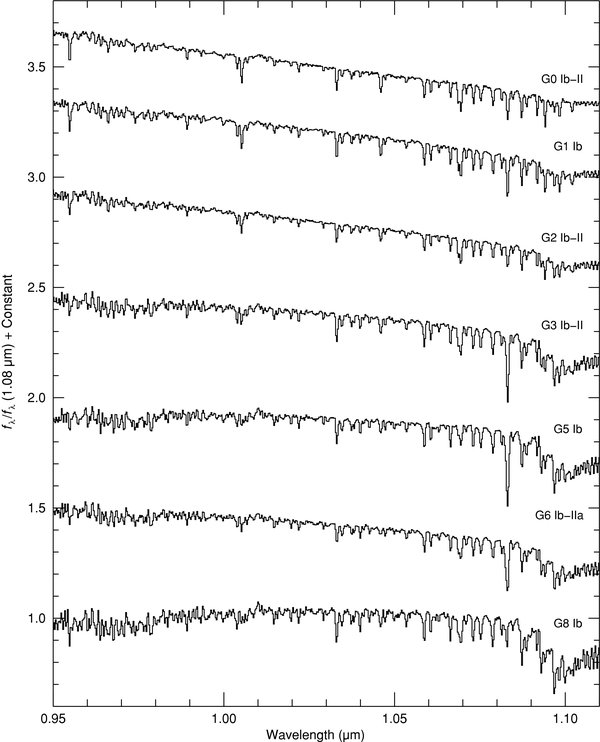
Figure 64. Sequence of G supergiant stars plotted over the Y band (0.95–1.10 μm). The spectra are of HD 185018 (G0 Ib–II), HD 74395 (G1 Ib), HD 3421 (G2 Ib–II), HD 192713 (G3 Ib–II Wk H&K comp?), HD 190113 (G5 Ib), HD 202314 (G6 Ib–IIa Ca1 B0.5), and HD 208606 (G8 Ib). The spectra have been normalized to unity at 1.08 μm and offset by constants.
Download figure:
Standard image High-resolution image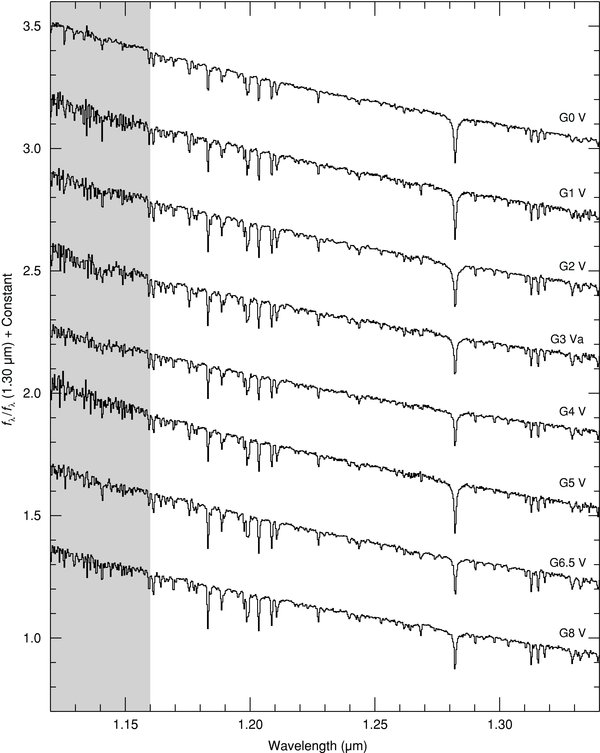
Figure 65. Sequence of G dwarf stars plotted over the J band (1.12–1.34 μm). The spectra are of HD 109358 (G0 V), HD 10307 (G1 V), HD 76151 (G2 V), HD 10697 (G3 Va), HD 214850 (G4 V), HD 165185 (G5 V), HD 115617 (G6.5 V), and HD 101501 (G8 V). The spectra have been normalized to unity at 1.30 μm and offset by constants.
Download figure:
Standard image High-resolution image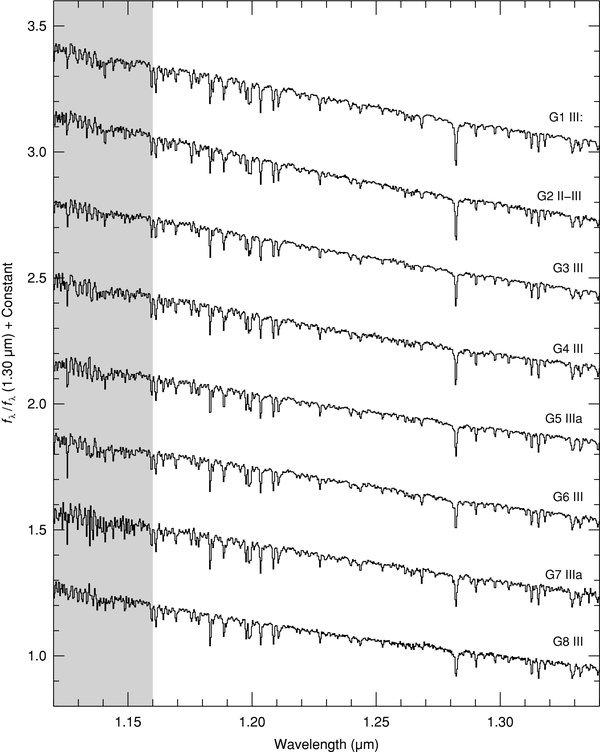
Figure 66. Sequence of G giant stars plotted over the J band (1.12–1.34 μm). The spectra are of HD 21018 (G1 III:CH–1:), HD 219477 (G2 II–III), HD 88639 (G3b III Fe–1), HD 108477 (G4 III), HD 193896 (G5 IIIa), HD 27277 (G6 III), HD 182694 (G7 IIIa), and HD 135722 (G8 III Fe–1). The spectra have been normalized to unity at 1.30 μm and offset by constants.
Download figure:
Standard image High-resolution image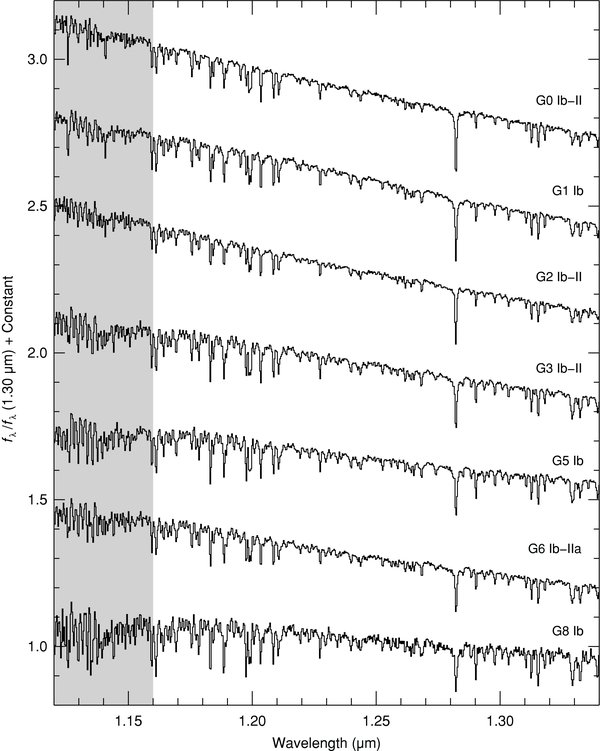
Figure 67. Sequence of G supergiant stars plotted over the J band (1.12–1.34 μm). The spectra are of HD 185018 (G0 Ib–II), HD 74395 (G1 Ib), HD 3421 (G2 Ib–II), HD 192713 (G3 Ib–II Wk H&K comp?), HD 190113 (G5 Ib), HD 202314 (G6 Ib–IIa Ca1 B0.5), and HD 208606 (G8 Ib). The spectra have been normalized to unity at 1.30 μm and offset by constants.
Download figure:
Standard image High-resolution image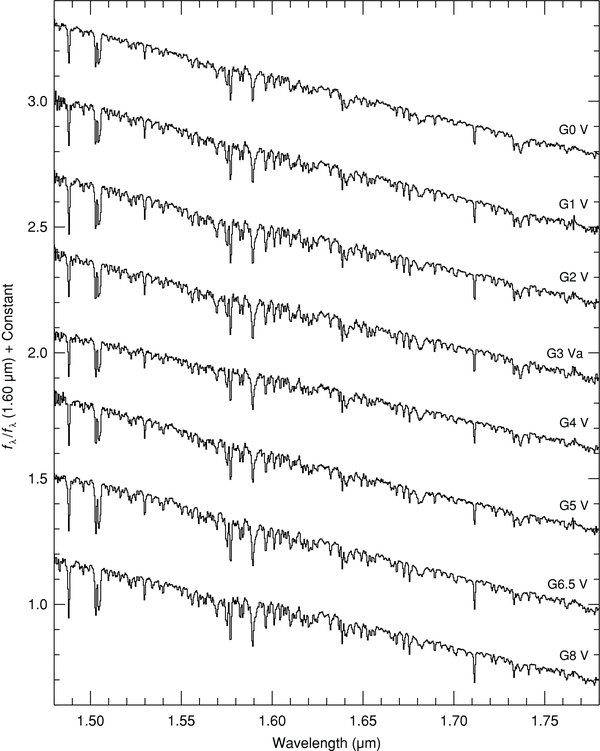
Figure 68. Sequence of G dwarf stars plotted over the H band (1.48–1.78 μm). The spectra are of HD 109358 (G0 V), HD 10307 (G1 V), HD 76151 (G2 V), HD 10697 (G3 Va), HD 214850 (G4 V), HD 165185 (G5 V), HD 115617 (G6.5 V), and HD 101501 (G8 V). The spectra have been normalized to unity at 1.60 μm and offset by constants.
Download figure:
Standard image High-resolution image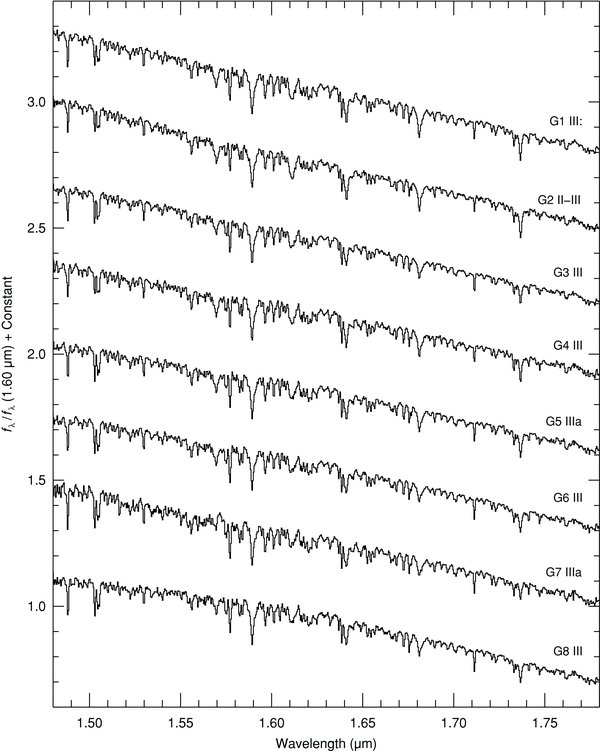
Figure 69. Sequence of G giant stars plotted over the H band (1.48–1.78 μm). The spectra are of HD 21018 (G1 III:CH–1:), HD 219477 (G2 II–III), HD 88639 (G3b III Fe–1), HD 108477 (G4 III), HD 193896 (G5 IIIa), HD 27277 (G6 III), HD 182694 (G7 IIIa), and HD 135722 (G8 III Fe–1). The spectra have been normalized to unity at 1.60 μm and offset by constants.
Download figure:
Standard image High-resolution image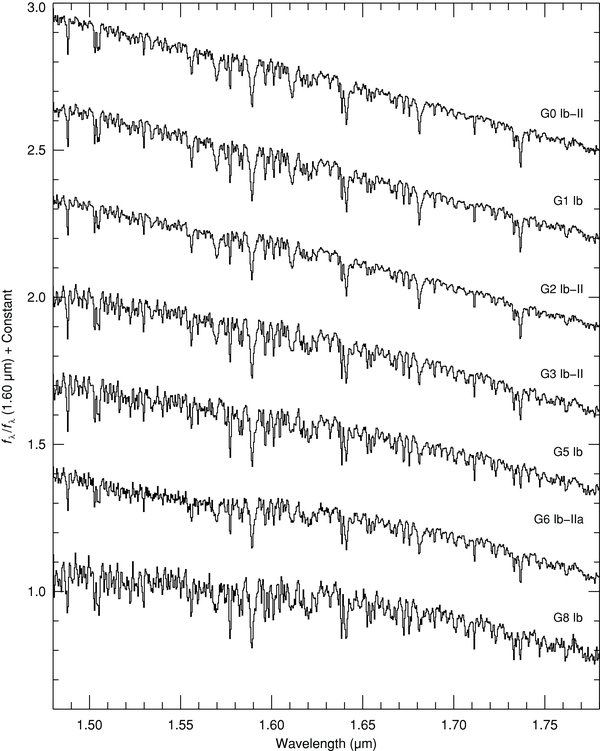
Figure 70. Sequence of G supergiant stars plotted over the H band (1.48–1.78 μm). The spectra are of HD 185018 (G0 Ib–II), HD 74395 (G1 Ib), HD 3421 (G2 Ib–II), HD 192713 (G3 Ib–II Wk H&K comp?), HD 190113 (G5 Ib), HD 202314 (G6 Ib–IIa Ca1 B0.5), and HD 208606 (G8 Ib). The spectra have been normalized to unity at 1.60 μm and offset by constants.
Download figure:
Standard image High-resolution image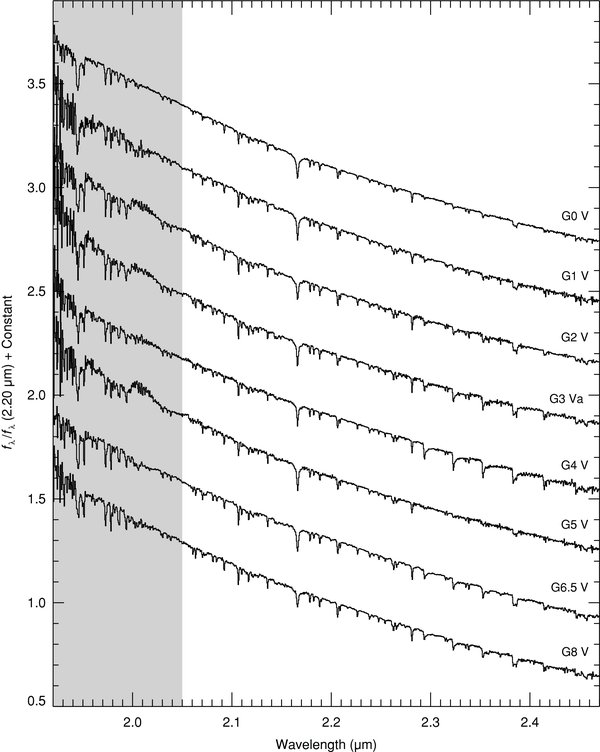
Figure 71. Sequence of G dwarf stars plotted over the K band (1.92–2.58 μm). The spectra are of HD 109358 (G0 V), HD 10307 (G1 V), HD 76151 (G2 V), HD 10697 (G3 Va), HD 214850 (G4 V), HD 165185 (G5 V), HD 115617 (G6.5 V), and HD 101501 (G8 V). The spectra have been normalized to unity at 2.20 μm and offset by constants.
Download figure:
Standard image High-resolution image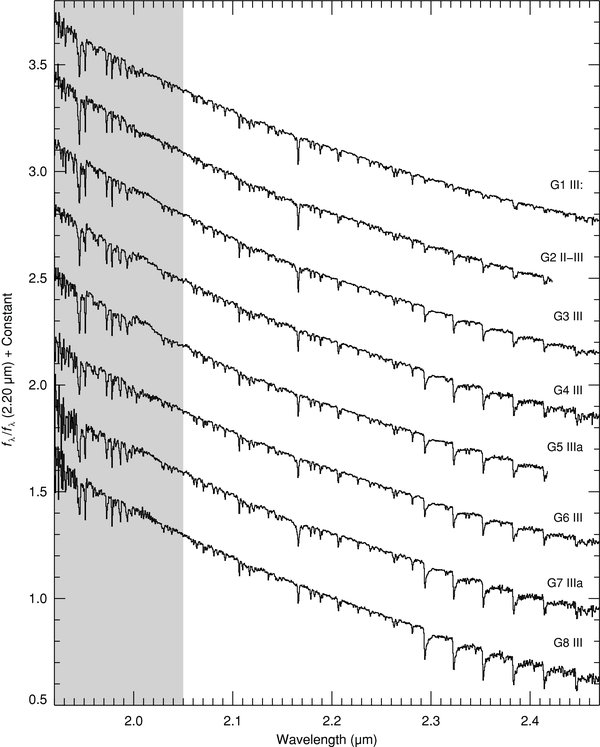
Figure 72. Sequence of G giant stars plotted over the K band (1.92–2.5 μm). The spectra are of HD 21018 (G1 III:CH–1:), HD 219477 (G2 II–III), HD 88639 (G3b III Fe–1), HD 108477 (G4 III), HD 193896 (G5 IIIa), HD 27277 (G6 III), HD 182694 (G7 IIIa), and HD 135722 (G8 III Fe–1). The spectra have been normalized to unity at 2.20 μm and offset by constants.
Download figure:
Standard image High-resolution image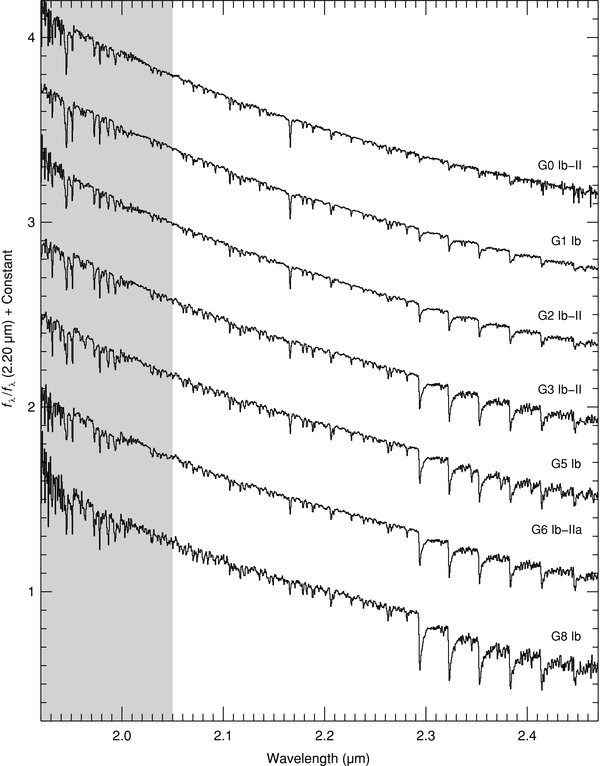
Figure 73. Sequence of G supergiant stars plotted over the K band (1.92–2.5 μm). The spectra are of HD 185018 (G0 Ib–II), HD 74395 (G1 Ib), HD 3421 (G2 Ib–II), HD 192713 (G3 Ib–II Wk H&K comp?), HD 190113 (G5 Ib), HD 202314 (G6 Ib–IIa Ca1 B0.5), and HD 208606 (G8 Ib). The spectra have been normalized to unity at 2.20 μm and offset by constants.
Download figure:
Standard image High-resolution image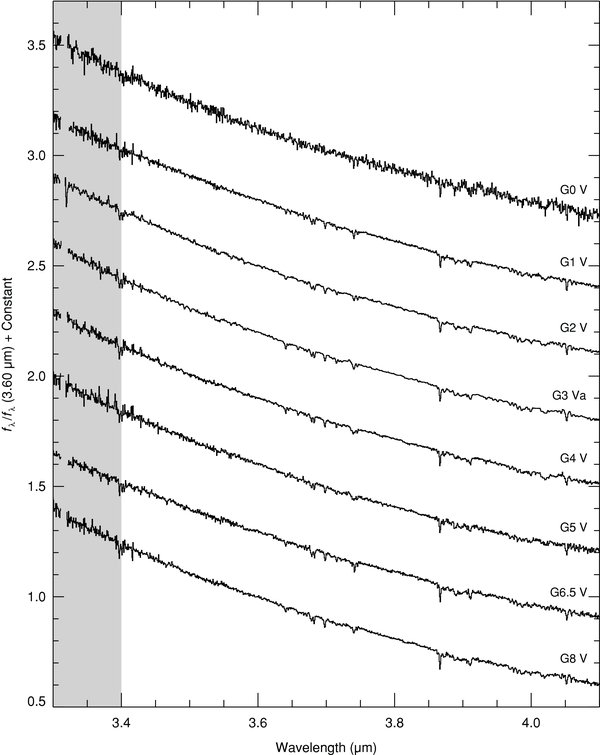
Figure 74. Sequence of G dwarf stars plotted over the L' band (3.3–4.1 μm). The spectra are of HD 109358 (G0 V), HD 10307 (G1 V), HD 76151 (G2 V), HD 10697 (G3 Va), HD 214850 (G4 V), HD 165185 (G5 V), HD 115617 (G6.5 V), and HD 101501 (G8 V). The spectra have been normalized to unity at 3.6 μm and offset by constants.
Download figure:
Standard image High-resolution image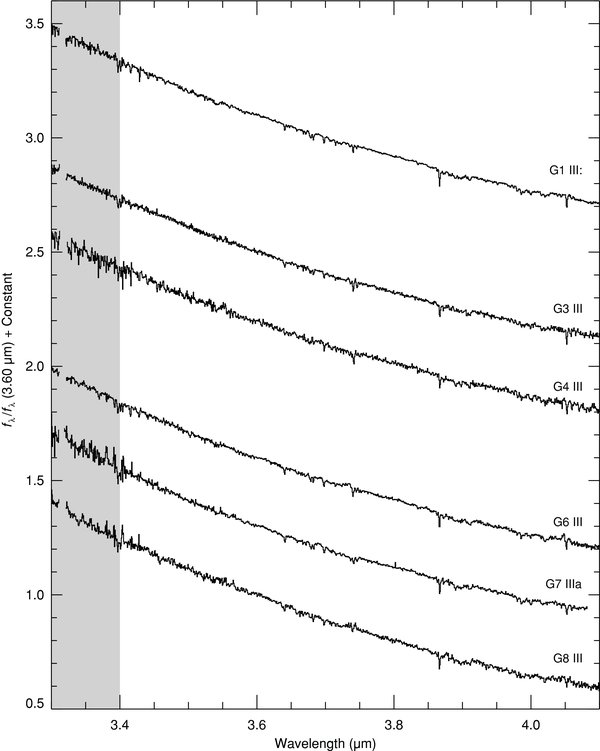
Figure 75. Sequence of G giant stars plotted over the L' band (3.6–4.1 μm). The spectra are of HD 21018 (G1 III:CH–1:), HD 219477 (G2 II–III), HD 88639 (G3b III Fe–1), HD 108477 (G4 III), HD 193896 (G5 IIIa), HD 27277 (G6 III), HD 182694 (G7 IIIa), and HD 135722 (G8 III Fe–1). The spectra have been normalized to unity at 3.6 μm and offset by constants.
Download figure:
Standard image High-resolution image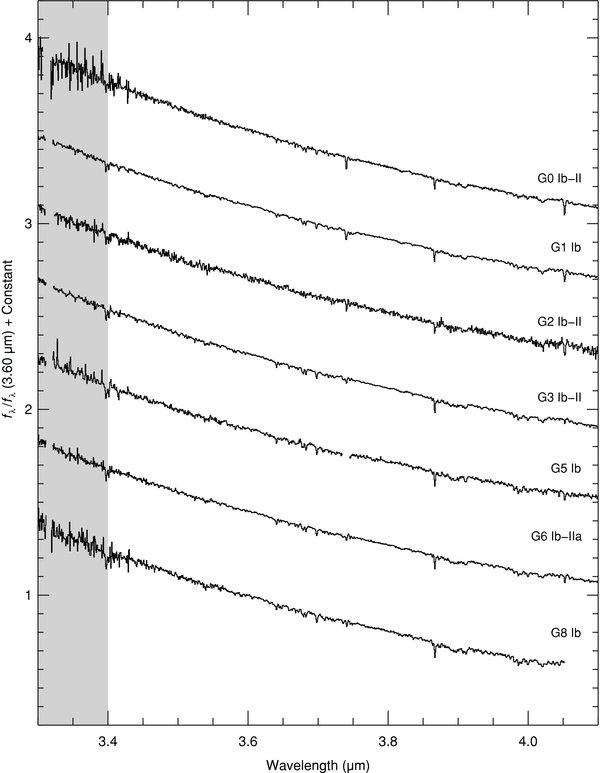
Figure 76. Sequence of G supergiant stars plotted over the L' band (3.6–4.1 μm). The spectra are of HD 185018 (G0 Ib–II), HD 74395 (G1 Ib), HD 3421 (G2 Ib–II), HD 192713 (G3 Ib–II Wk H&K comp?), HD 190113 (G5 Ib), HD 202314 (G6 Ib–IIa Ca1 B0.5), and HD 208606 (G8 Ib). The spectra have been normalized to unity at 3.6 μm and offset by constants.
Download figure:
Standard image High-resolution image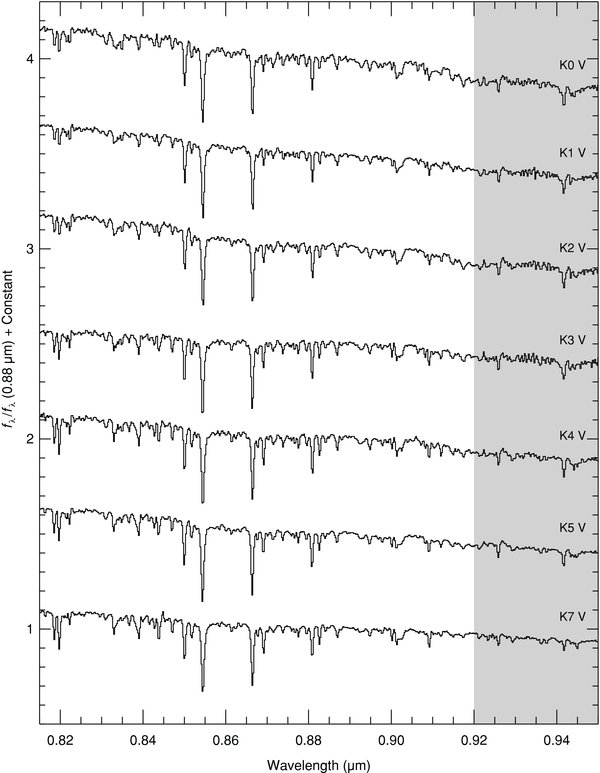
Figure 77. Sequence of K dwarf stars plotted over the I band (0.82–0.95 μm). The spectra are of HD 145675 (K0 V), HD 10476 (K1 V), HD 3765 (K2 V), HD 219134 (K3 V), HD 45977 (K4 V), HD 36003 (K5 V), and HD 237903 (K7 V). The spectra have been normalized to unity at 0.88 μm and offset by constants.
Download figure:
Standard image High-resolution image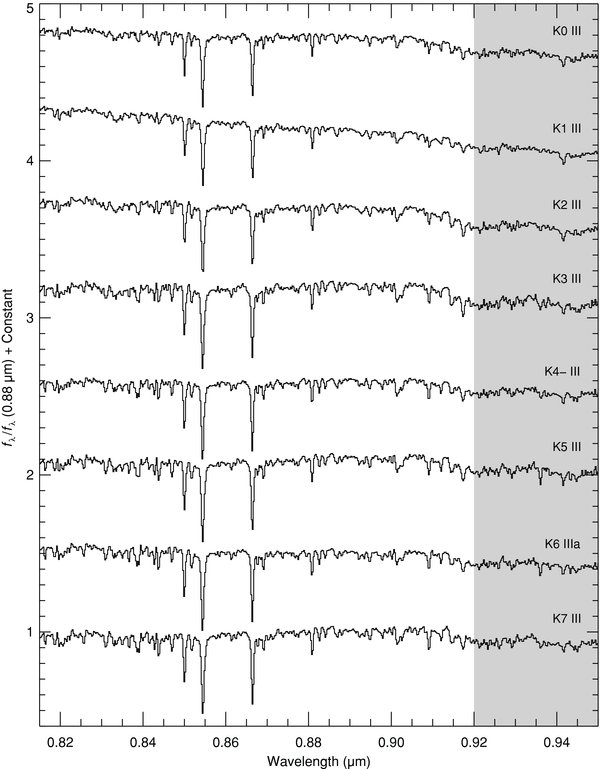
Figure 78. Sequence of K giant stars plotted over the I band (0.82–0.95 μm). The spectra are of HD 100006 (K0 III), HD 25975 (K1 III), HD 137759 (K2 III), HD 221246 (K3 III), HD 207991 (K4− III), HD 181596 (K5 III), HD 3346 (K6 IIIa), and HD 194193 (K7 III). The spectra have been normalized to unity at 0.88 μm and offset by constants.
Download figure:
Standard image High-resolution image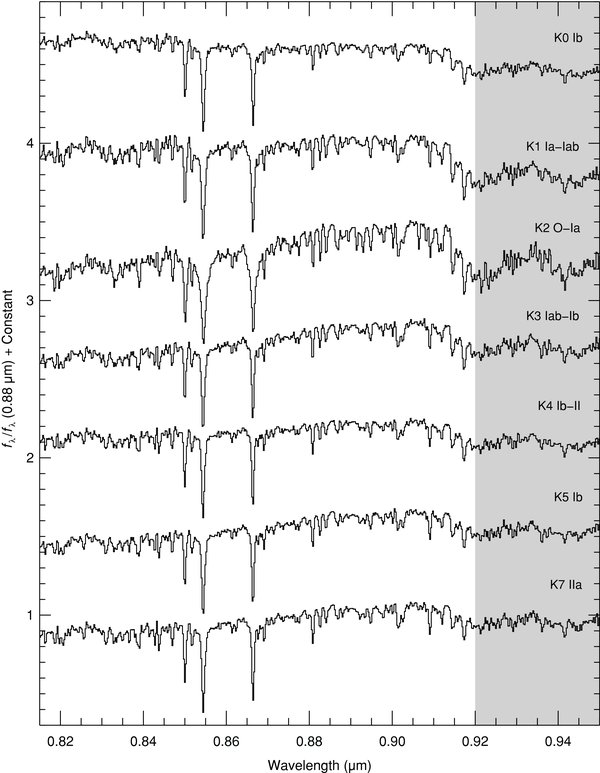
Figure 79. Sequence of K supergiant stars plotted over the I band (0.82–0.95 μm). The spectra are of HD 44391 (K0 Ib), HD 63302 (K1 Ia–Iab), HD 212466 (K2 O–Ia), HD 187238 (K3 Iab–Ib), HD 201065 (K4 Ib–II), HD 216946 (K5 Ib), and HD 181475 (K7 IIa). The spectra have been normalized to unity at 0.88 μm and offset by constants.
Download figure:
Standard image High-resolution image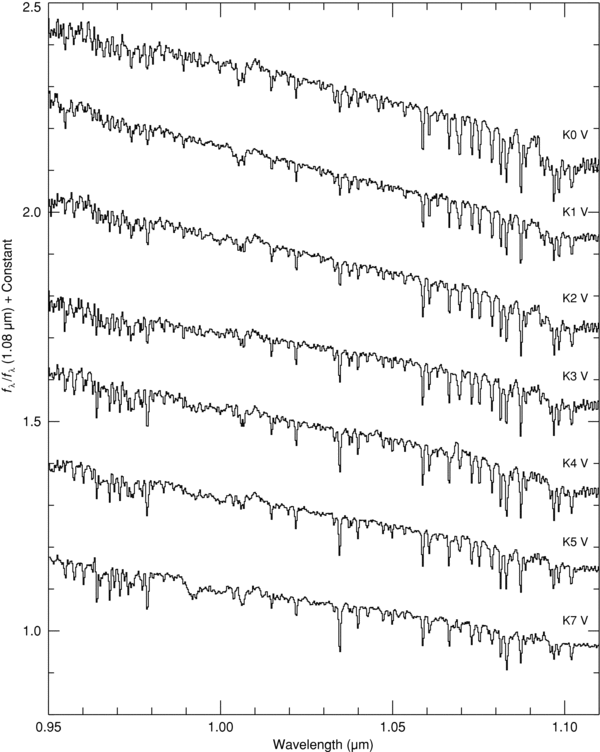
Figure 80. Sequence of K dwarf stars plotted over the Y band (0.95–0.10 μm). The spectra are of HD 145675 (K0 V), HD 10476 (K1 V), HD 3765 (K2 V), HD 219134 (K3 V), HD 45977 (K4 V), HD 36003 (K5 V), and HD 237903 (K7 V). The spectra have been normalized to unity at 1.08 μm and offset by constants.
Download figure:
Standard image High-resolution image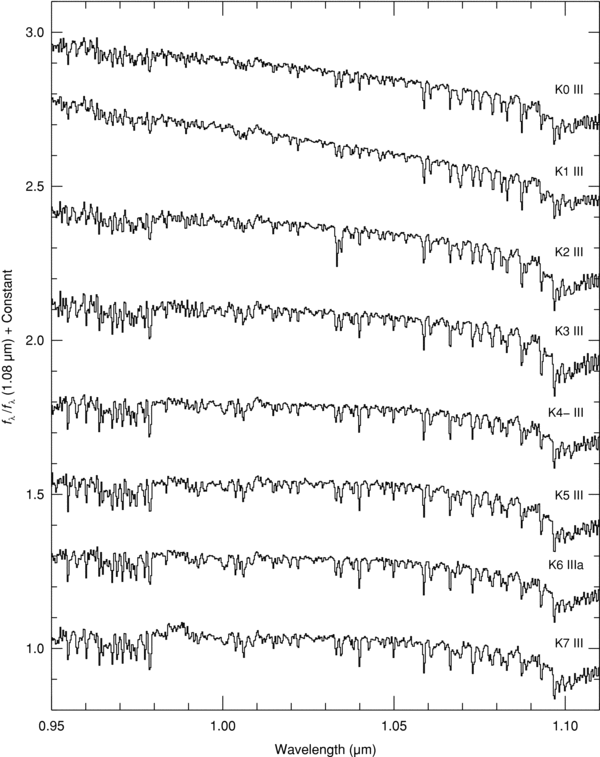
Figure 81. Sequence of K giant stars plotted over the Y band (0.95–1.10 μm). The spectra are of HD 100006 (K0 III), HD 25975 (K1 III), HD 137759 (K2 III), HD 221246 (K3 III), HD 207991 (K4− III), HD 181596 (K5 III), HD 3346 (K6 IIIa), and HD 194193 (K7 III). The spectra have been normalized to unity at 1.08 μm and offset by constants.
Download figure:
Standard image High-resolution image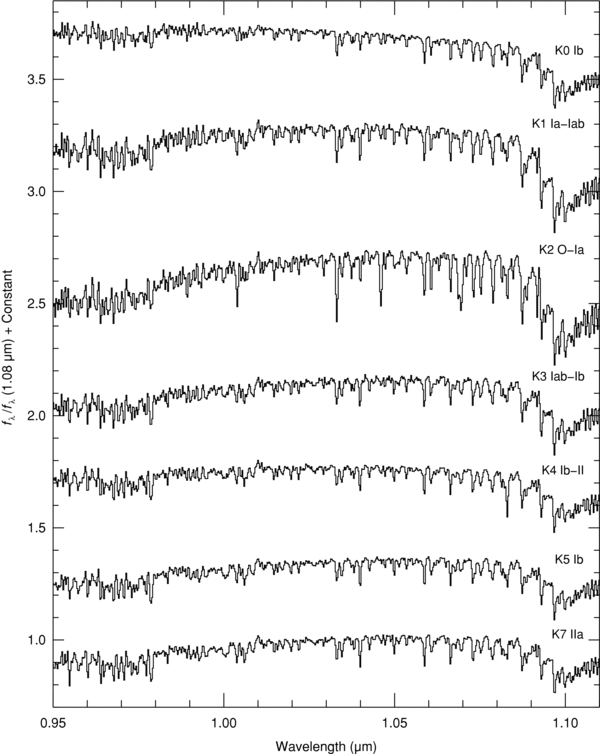
Figure 82. Sequence of K supergiant stars plotted over the Y band (0.95–1.10 μm). The spectra are of HD 44391 (K0 Ib), HD 63302 (K1 Ia–Iab), HD 212466 (K2 O–Ia), HD 187238 (K3 Iab–Ib), HD 201065 (K4 Ib–II), HD 216946 (K5 Ib), and HD 181475 (K7 IIa). The spectra have been normalized to unity at 1.08 μm and offset by constants.
Download figure:
Standard image High-resolution image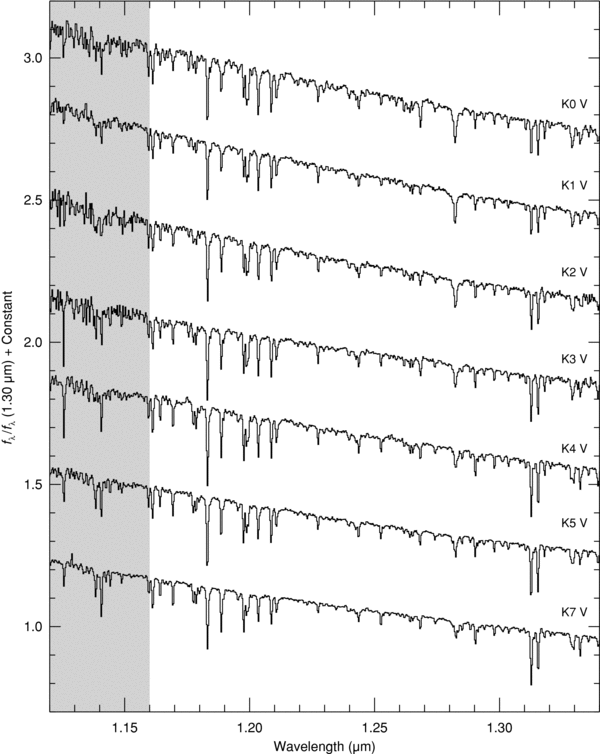
Figure 83. Sequence of K dwarf stars plotted over the J band (1.12–1.34 μm). The spectra are of HD 145675 (K0 V), HD 10476 (K1 V), HD 3765 (K2 V), HD 219134 (K3 V), HD 45977 (K4 V), HD 36003 (K5 V), and HD 237903 (K7 V). The spectra have been normalized to unity at 1.30 μm and offset by constants.
Download figure:
Standard image High-resolution image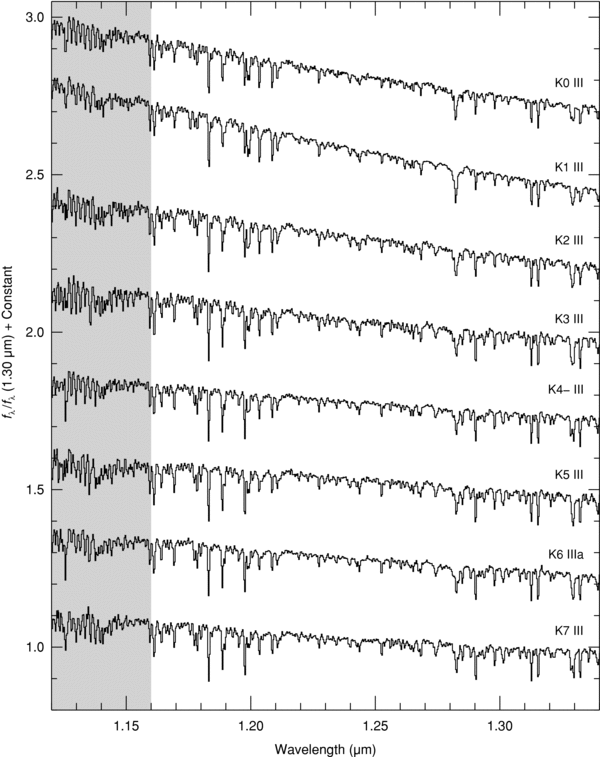
Figure 84. Sequence of K giant stars plotted over the J band (1.12–1.34 μm). The spectra are of HD 100006 (K0 III), HD 25975 (K1 III), HD 137759 (K2 III), HD 221246 (K3 III), HD 207991 (K4− III), HD 181596 (K5 III), HD 3346 (K6 IIIa), and HD 194193 (K7 III). The spectra have been normalized to unity at 1.30 μm and offset by constants.
Download figure:
Standard image High-resolution image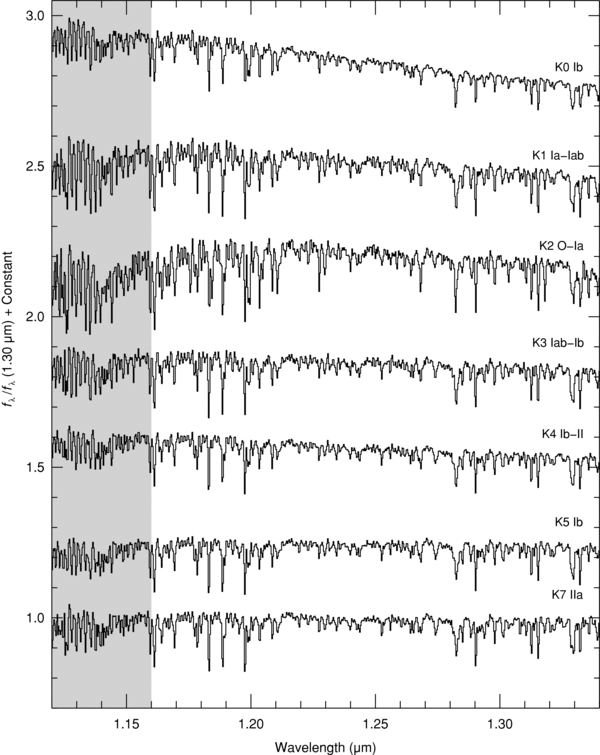
Figure 85. Sequence of K supergiant stars plotted over the J band (1.12–1.34 μm). The spectra are of HD 44391 (K0 Ib), HD 63302 (K1 Ia–Iab), HD 212466 (K2 O–Ia), HD 187238 (K3 Iab–Ib), HD 201065 (K4 Ib–II), HD 216946 (K5 Ib), and HD 181475 (K7 IIa). The spectra have been normalized to unity at 1.30 μm and offset by constants.
Download figure:
Standard image High-resolution image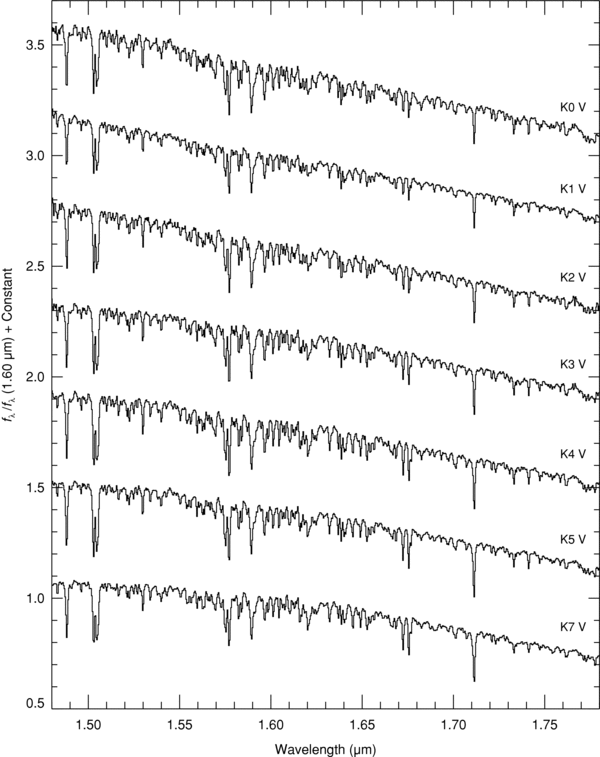
Figure 86. Sequence of K dwarf stars plotted over the H band (1.48–1.78 μm). The spectra are of HD 145675 (K0 V), HD 10476 (K1 V), HD 3765 (K2 V), HD 219134 (K3 V), HD 45977 (K4 V), HD 36003 (K5 V), and HD 237903 (K7 V). The spectra have been normalized to unity at 1.60 μm and offset by constants.
Download figure:
Standard image High-resolution image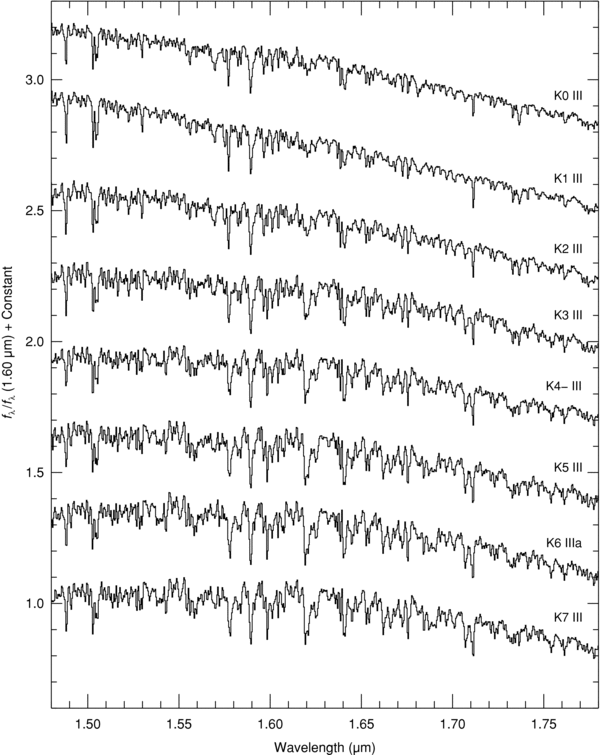
Figure 87. Sequence of K giant stars plotted over the H band (1.48–1.78 μm). The spectra are of HD 100006 (K0 III), HD 25975 (K1 III), HD 137759 (K2 III), HD 221246 (K3 III), HD 207991 (K4− III), HD 181596 (K5 III), HD 3346 (K6 IIIa), and HD 194193 (K7 III). The spectra have been normalized to unity at 1.60 μm and offset by constants.
Download figure:
Standard image High-resolution image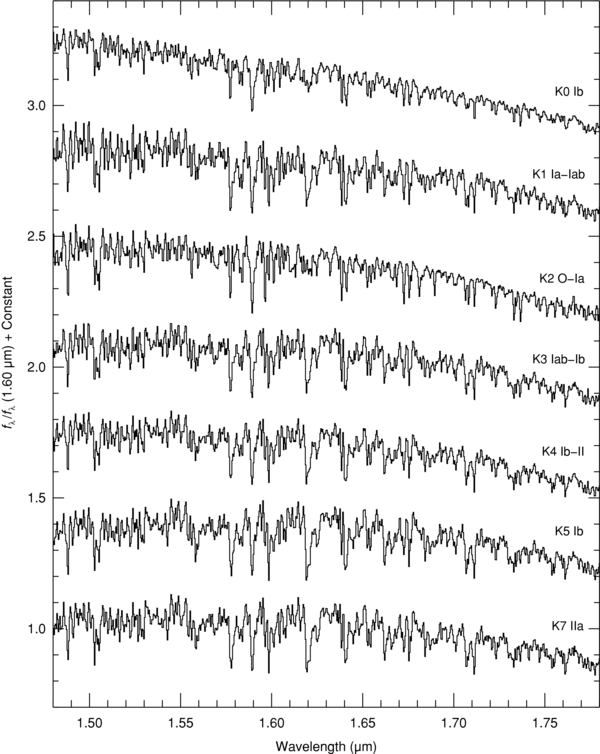
Figure 88. Sequence of K supergiant stars plotted over the H band (1.48–1.78 μm). The spectra are of HD 44391 (K0 Ib), HD 63302 (K1 Ia–Iab), HD 212466 (K2 O–Ia), HD 187238 (K3 Iab–Ib), HD 201065 (K4 Ib–II), HD 216946 (K5 Ib), and HD 181475 (K7 IIa). The spectra have been normalized to unity at 1.60 μm and offset by constants.
Download figure:
Standard image High-resolution image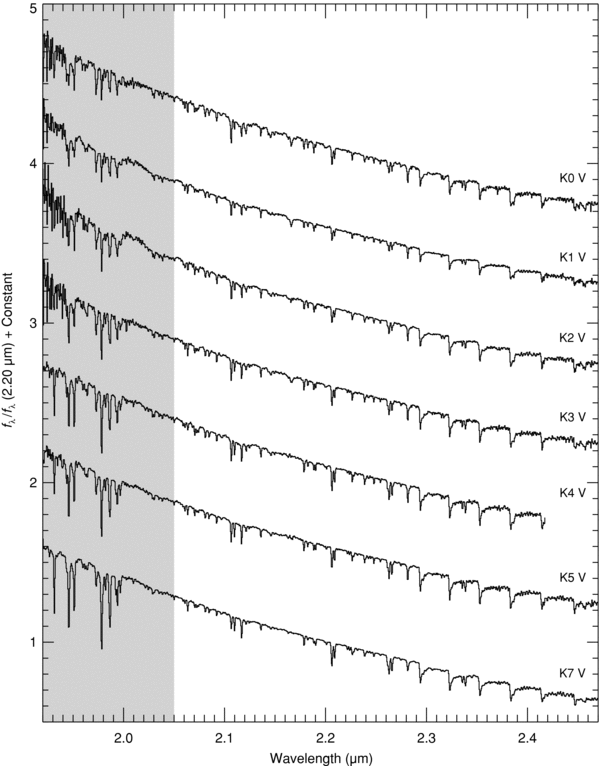
Figure 89. Sequence of K dwarf stars plotted over the K band (1.92–2.5 μm). The spectra are of HD 145675 (K0 V), HD 10476 (K1 V), HD 3765 (K2 V), HD 219134 (K3 V), HD 45977 (K4 V), HD 36003 (K5 V), and HD 237903 (K7 V). The spectra have been normalized to unity at 2.20 μm and offset by constants.
Download figure:
Standard image High-resolution image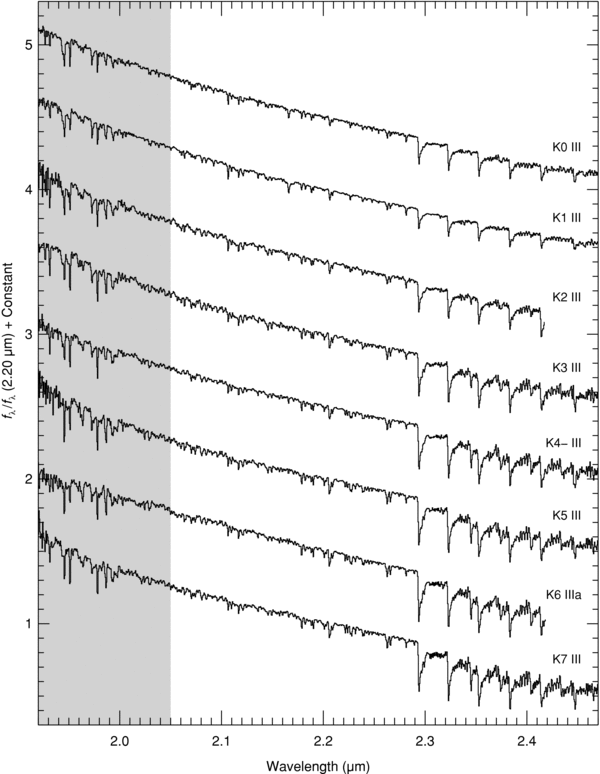
Figure 90. Sequence of K giant stars plotted over the K band (1.92–2.5 μm). The spectra are of HD 100006 (K0 III), HD 25975 (K1 III), HD 137759 (K2 III), HD 221246 (K3 III), HD 207991 (K4− III), HD 181596 (K5 III), HD 3346 (K6 IIIa), and HD 194193 (K7 III). The spectra have been normalized to unity at 2.20 μm and offset by constants.
Download figure:
Standard image High-resolution image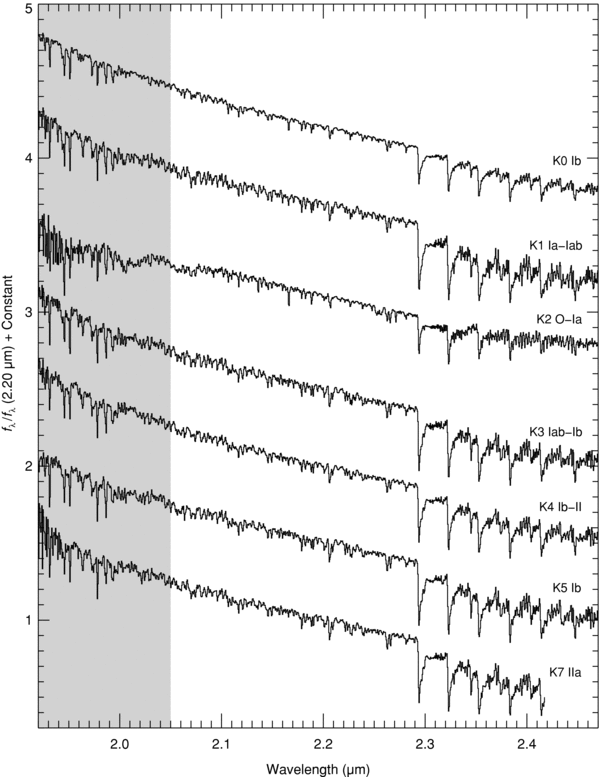
Figure 91. Sequence of K supergiant stars plotted over the K band (1.92–2.5 μm). The spectra are of HD 44391 (K0 Ib), HD 63302 (K1 Ia–Iab), HD 212466 (K2 O–Ia), HD 187238 (K3 Iab–Ib), HD 201065 (K4 Ib–II), HD 216946 (K5 Ib), and HD 181475 (K7 IIa). The spectra have been normalized to unity at 2.20 μm and offset by constants.
Download figure:
Standard image High-resolution image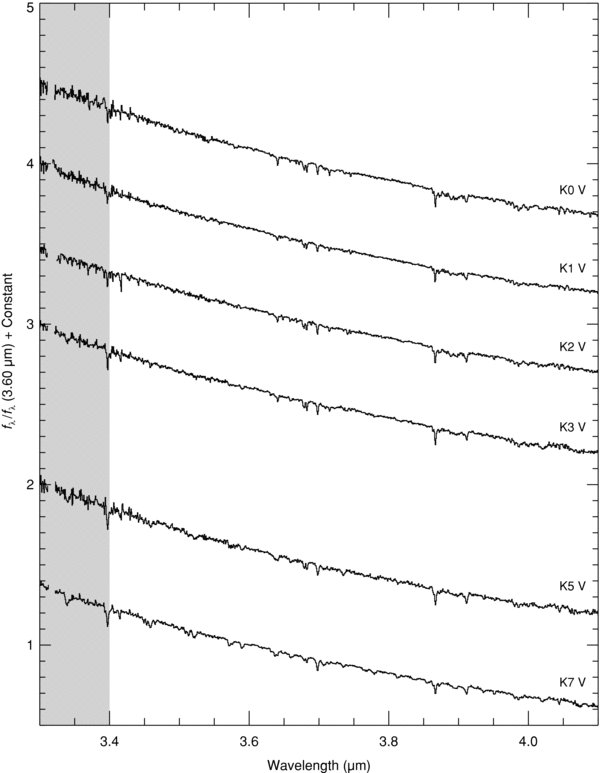
Figure 92. Sequence of K dwarf stars plotted over the L' band (3.6–4.1 μm). The spectra are of HD 145675 (K0 V), HD 10476 (K1 V), HD 3765 (K2 V), HD 219134 (K3 V), HD 36003 (K5 V), and HD 237903 (K7 V). The spectra have been normalized to unity at 2.20 μm and offset by constants.
Download figure:
Standard image High-resolution image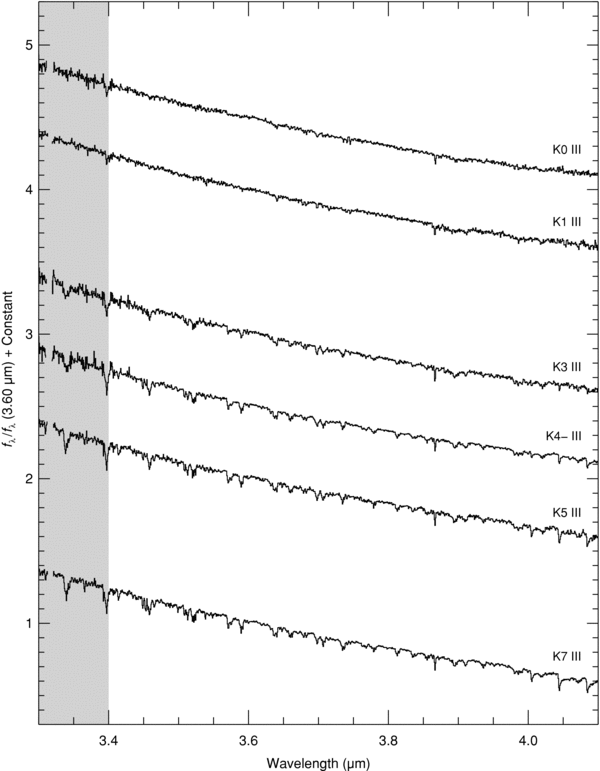
Figure 93. Sequence of K giant stars plotted over the L' band (3.6–4.1 μm). The spectra are of HD 100006 (K0 III), HD 25975 (K1 III), HD 137759 (K2 III), HD 221246 (K3 III), HD 207991 (K4− III), HD 181596 (K5 III), and HD 194193 (K7 III). The spectra have been normalized to unity at 3.6 μm and offset by constants.
Download figure:
Standard image High-resolution image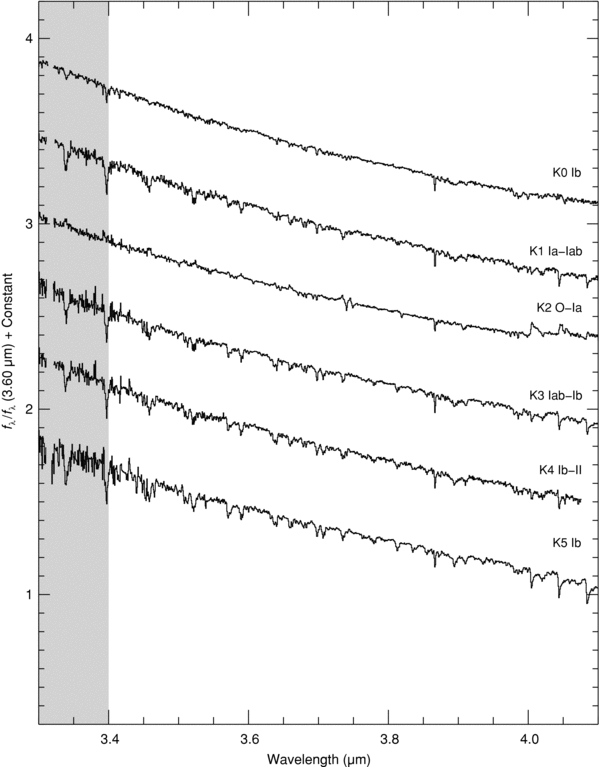
Figure 94. Sequence of K supergiant stars plotted over the L' band (3.6–4.1 μm). The spectra are of HD 44391 (K0 Ib), HD 63302 (K1 Ia–Iab), HD 212466 (K2 O–Ia), HD 187238 (K3 Iab–Ib), HD 201065 (K4 Ib–II), and HD 216946 (K5 Ib). The spectra have been normalized to unity at 3.6 μm and offset by constants.
Download figure:
Standard image High-resolution image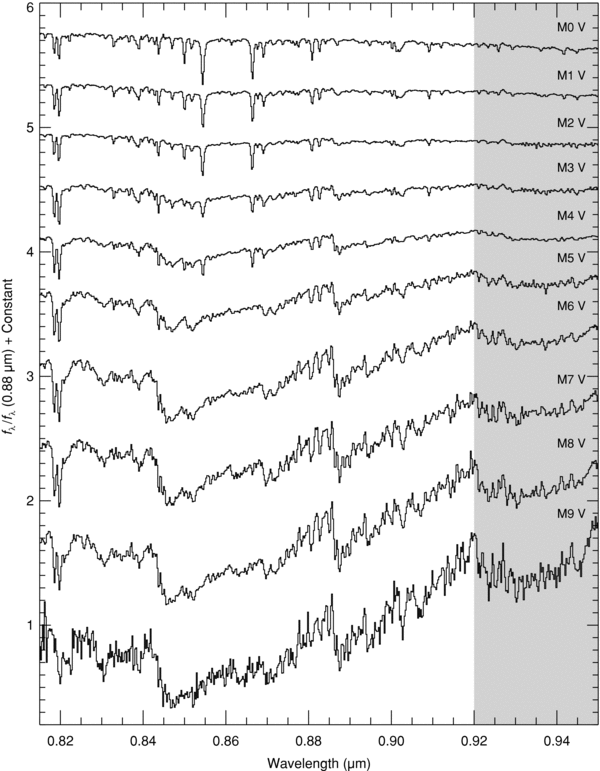
Figure 95. Sequence of M dwarf stars plotted over the I band (0.82–0.95 μm). The spectra are of HD 19305 (M0 V), HD 42581 (M1 V), HD 95735 (M2 V), Gl 388 (M3 V), Gl 213 (M4 V), Gl 51 (M5 V), Gl 406 (M6 V), Gl 644C (M7 V), Gl 752B (M8 V), and LP944-20 (M9 V). The spectra have been normalized to unity at 0.88 μm and offset by constants.
Download figure:
Standard image High-resolution image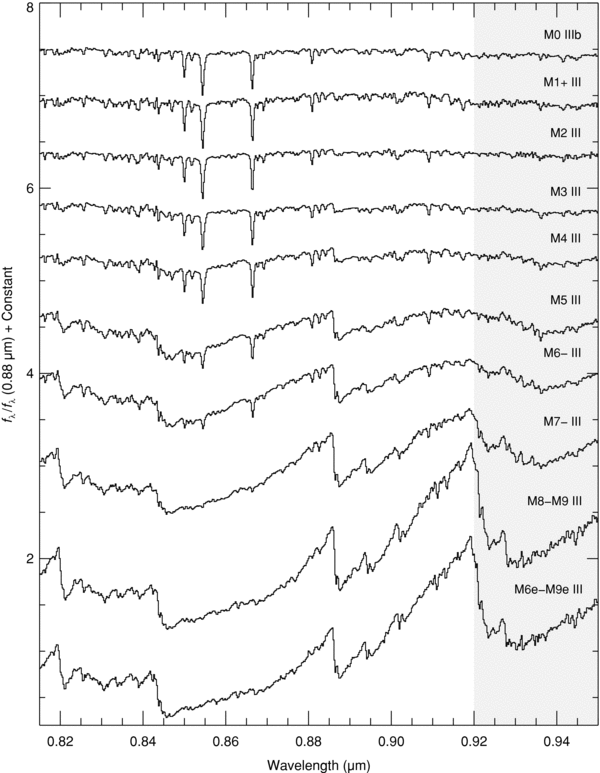
Figure 96. Sequence of M giant stars plotted over the I band (0.82–0.95 μm). The spectra are of HD 213893 (M0 IIIb), HD 204724 (M1+ III), HD 120052 (M2 III), HD 39045 (M3 III), HD 4408 (M4 III), HD 175865 (M5 III), HD 18191 (M6− III), HD 108849 (M7− III), IRAS 21284 − 0747 (M8–M9 III), and HD 69243 (M6e–M9e III). The spectra have been normalized to unity at 0.88 μm and offset by constants.
Download figure:
Standard image High-resolution image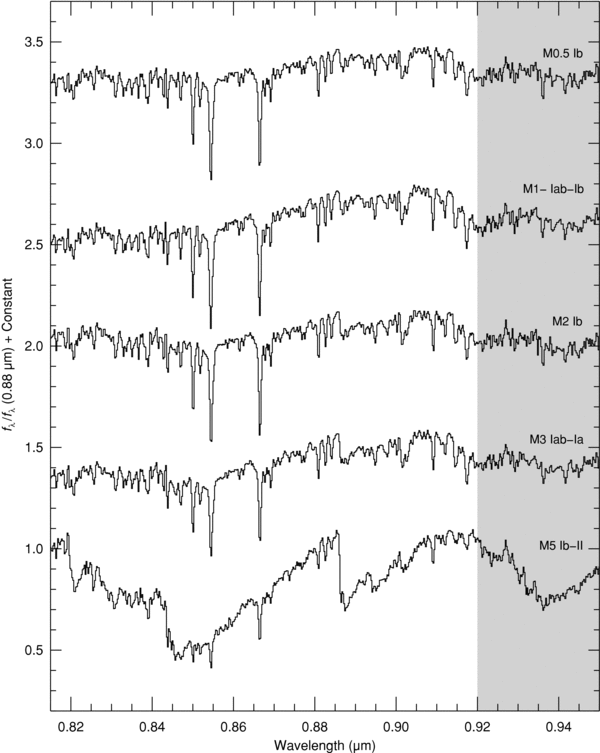
Figure 97. Sequence of M supergiant stars plotted over the I band (0.82–0.95 μm). The spectra are of HD 236697 (M0.5 Ib), HD 14404 (M1− Iab–Ib), HD 10465 (M2 Ib), CD −31 4916 (M3 Iab–Ia), and HD 156014 (M5 Ib–II). The spectra have been normalized to unity at 0.88 μm and offset by constants.
Download figure:
Standard image High-resolution image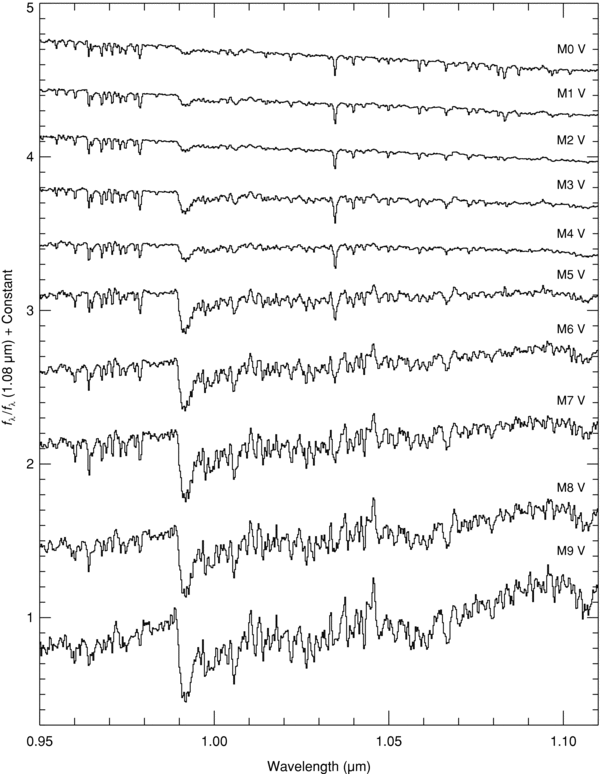
Figure 98. Sequence of M dwarf stars plotted over the Y band (0.95–1.10 μm). The spectra are of HD 19305 (M0 V), HD 42581 (M1 V), HD 95735 (M2 V), Gl 388 (M3 V), Gl 213 (M4 V), Gl 51 (M5 V), Gl 406 (M6 V), Gl 644C (M7 V), Gl 752B (M8 V), and LP944 − 20 (M9 V). The spectra have been normalized to unity at 1.08 μm and offset by constants.
Download figure:
Standard image High-resolution image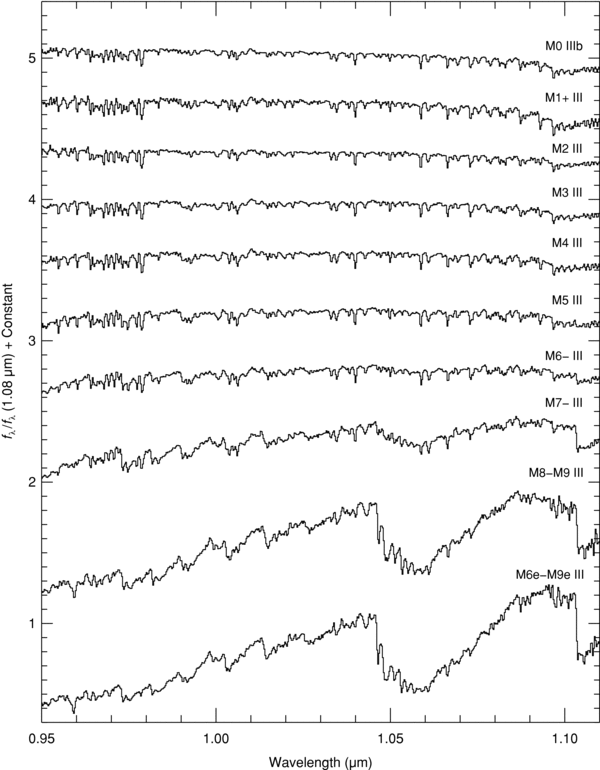
Figure 99. Sequence of M giant stars plotted over the Y band (0.95–1.10 μm). The spectra are of HD 213893 (M0 IIIb), HD 204724 (M1+ III), HD 120052 (M2 III), HD 39045 (M3 III), HD 4408 (M4 III), HD 175865 (M5 III), HD 18191 (M6− III), HD 108849 (M7− III), IRAS 21284 − 0747 (M8–M9 III), and HD 69243 (M6e–M9e III). The spectra have been normalized to unity at 1.08 μm and offset by constants.
Download figure:
Standard image High-resolution image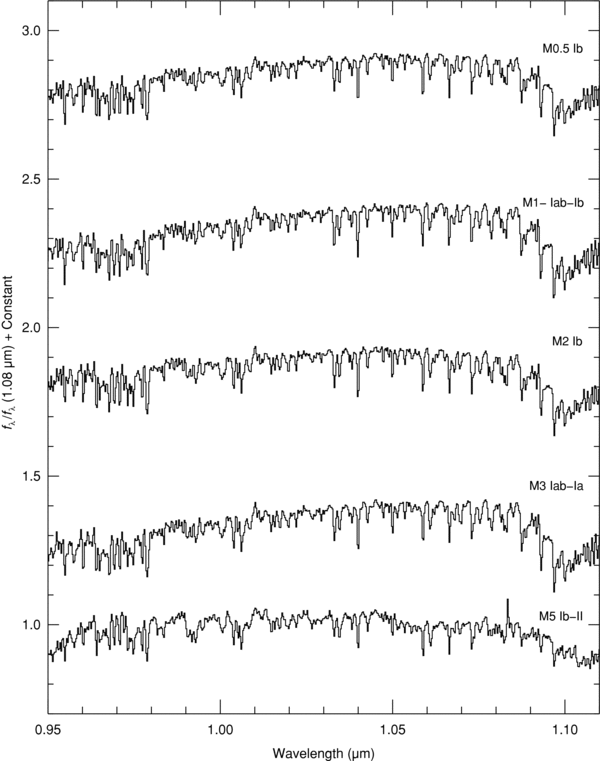
Figure 100. Sequence of M supergiant stars plotted over the Y band (0.95–1.10 μm). The spectra are of HD 236697 (M0.5 Ib), HD 14404 (M1− Iab–Ib), HD 10465 (M2 Ib), CD −31 4916 (M3 Iab–Ia), and HD 156014 (M5 Ib–II). The spectra have been normalized to unity at 1.08 μm and offset by constants.
Download figure:
Standard image High-resolution image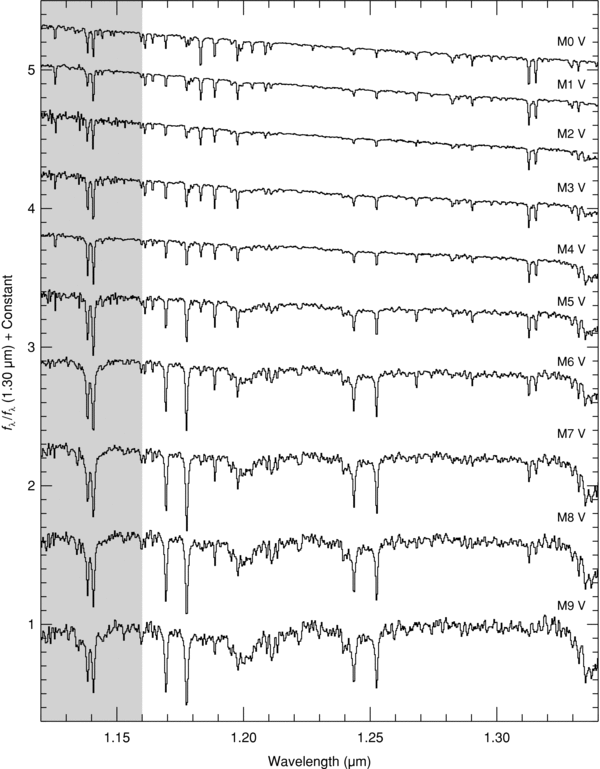
Figure 101. Sequence of M dwarf stars plotted over the J band (1.12–1.34 μm). The spectra are of HD 19305 (M0 V), HD 42581 (M1 V), HD 95735 (M2 V), Gl 388 (M3 V), Gl 213 (M4 V), Gl 51 (M5 V), Gl 406 (M6 V), Gl 644C (M7 V), Gl 752B (M8 V), and LP944 − 20 (M9 V). The spectra have been normalized to unity at 1.30 μm and offset by constants.
Download figure:
Standard image High-resolution image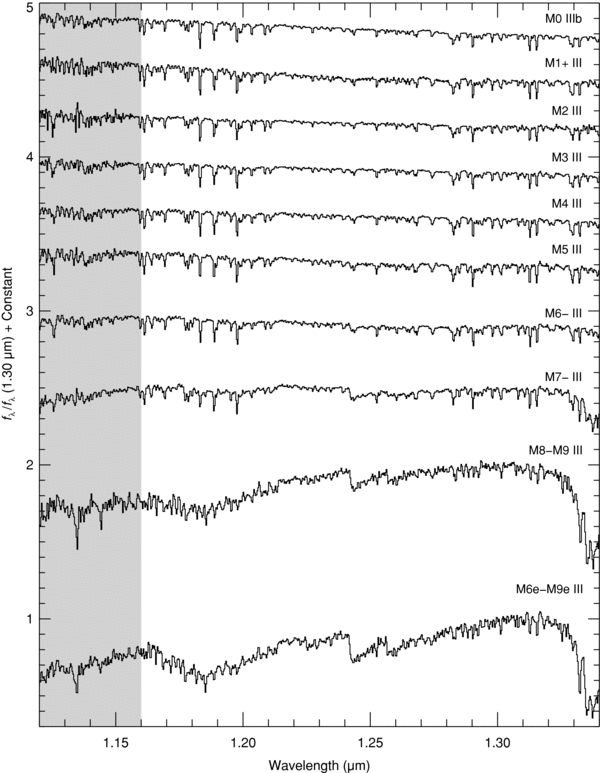
Figure 102. Sequence of M giant stars plotted over the J band (1.12–1.34 μm). The spectra are of HD 213893 (M0 IIIb), HD 204724 (M1+ III), HD 120052 (M2 III), HD 39045 (M3 III), HD 4408 (M4 III), HD 175865 (M5 III), HD 18191 (M6− III), HD 108849 (M7− III), IRAS 21284 − 0747 (M8–M9 III), and HD HD 69243 (M6e–M9e III). The spectra have been normalized to unity at 1.30 μm and offset by constants.
Download figure:
Standard image High-resolution image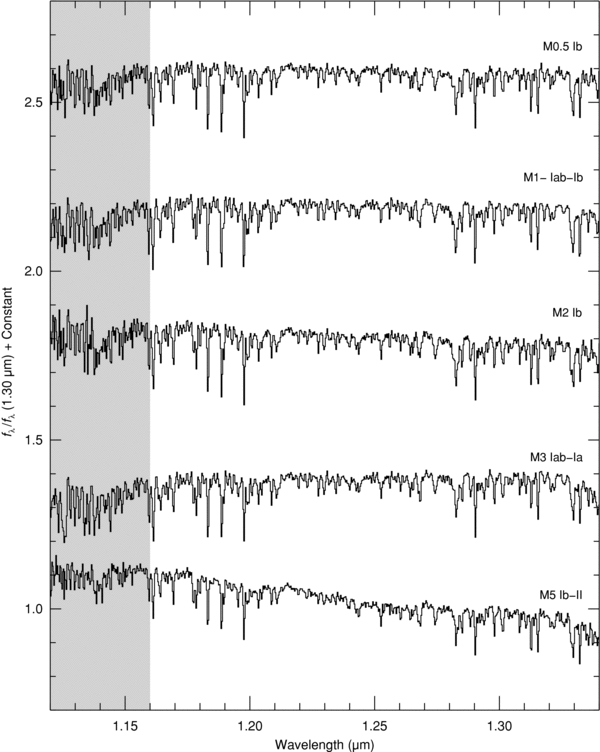
Figure 103. Sequence of M supergiant stars plotted over the J band (1.12–1.34 μm). The spectra are of HD 236697 (M0.5 Ib), HD 14404 (M1− Iab–Ib), HD 10465 (M2 Ib), CD −31 4916 (M3 Iab–Ia), and HD 156014 (M5 Ib–II). The spectra have been normalized to unity at 1.30 μm and offset by constants.
Download figure:
Standard image High-resolution image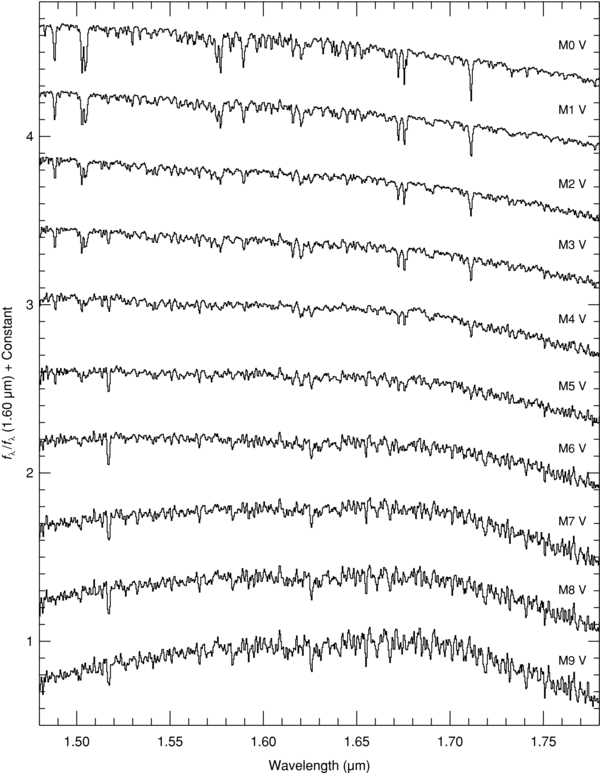
Figure 104. Sequence of M dwarf stars plotted over the H band (1.48–1.78 μm). The spectra are of HD 19305 (M0 V), HD 42581 (M1 V), HD 95735 (M2 V), Gl 388 (M3 V), Gl 213 (M4 V), Gl 51 (M5 V), Gl 406 (M6 V), Gl 644C (M7 V), Gl 752B (M8 V), and LP944 − 20 (M9 V). The spectra have been normalized to unity at 1.60 μm and offset by constants.
Download figure:
Standard image High-resolution image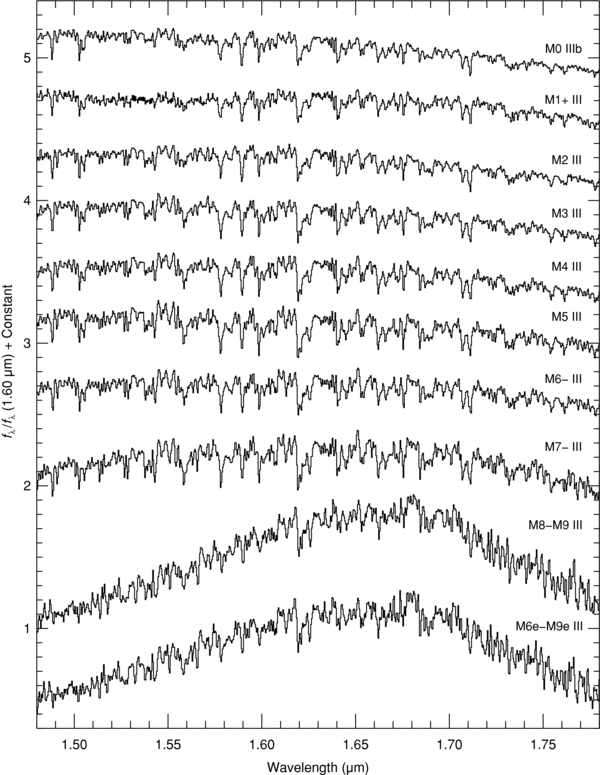
Figure 105. Sequence of M giant stars plotted over the H band (1.48–1.78 μm). The spectra are of HD 213893 (M0 IIIb), HD 204724 (M1+ III), HD 120052 (M2 III), HD 39045 (M3 III), HD 4408 (M4 III), HD 175865 (M5 III), HD 18191 (M6− III), HD 108849 (M7− III), IRAS 21284 − 0747 (M8–M9 III), and HD 69243 (M6e–M9e III). The spectra have been normalized to unity at 1.60 μm and offset by constants.
Download figure:
Standard image High-resolution image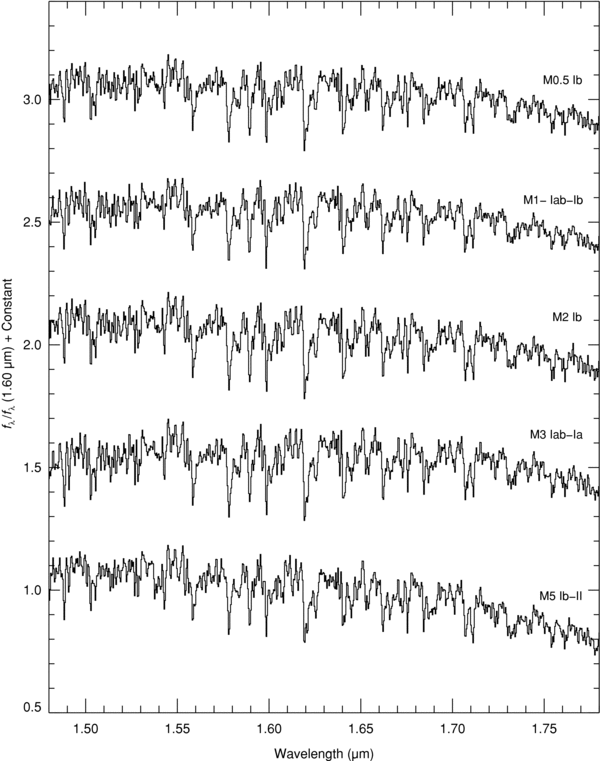
Figure 106. Sequence of M supergiant stars plotted over the H band (1.48–1.78 μm). The spectra are of HD 236697 (M0.5 Ib), HD 14404 (M1− Iab–Ib), HD 10465 (M2 Ib), CD −31 4916 (M3 Iab–Ia), and HD 156014 (M5 Ib–II). The spectra have been normalized to unity at 1.60 μm and offset by constants.
Download figure:
Standard image High-resolution image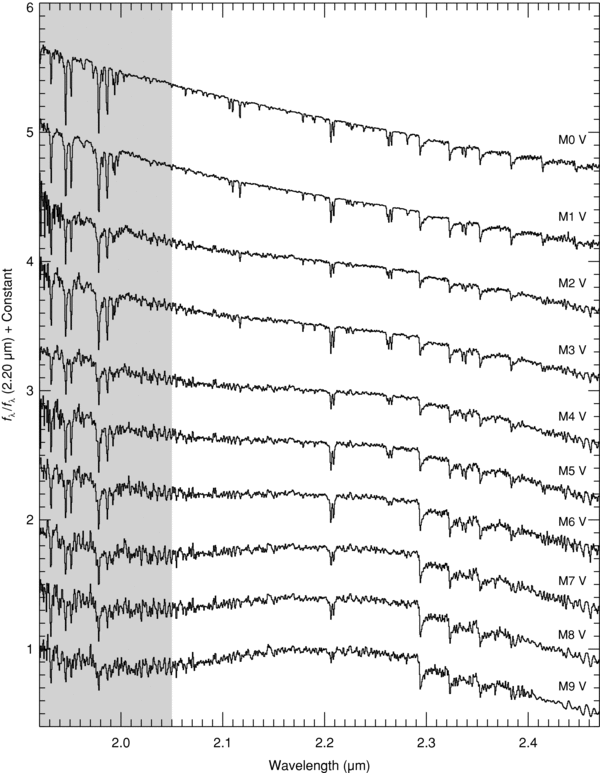
Figure 107. Sequence of M dwarf stars plotted over the K band (1.92–2.5 μm). The spectra are of HD 19305 (M0 V), HD 42581 (M1 V), HD 95735 (M2 V), Gl 388 (M3 V), Gl 213 (M4 V), Gl 51 (M5 V), Gl 406 (M6 V), Gl 644C (M7 V), Gl 752B (M8 V), and LP944 − 20 (M9 V). The spectra have been normalized to unity at 2.20 μm and offset by constants.
Download figure:
Standard image High-resolution image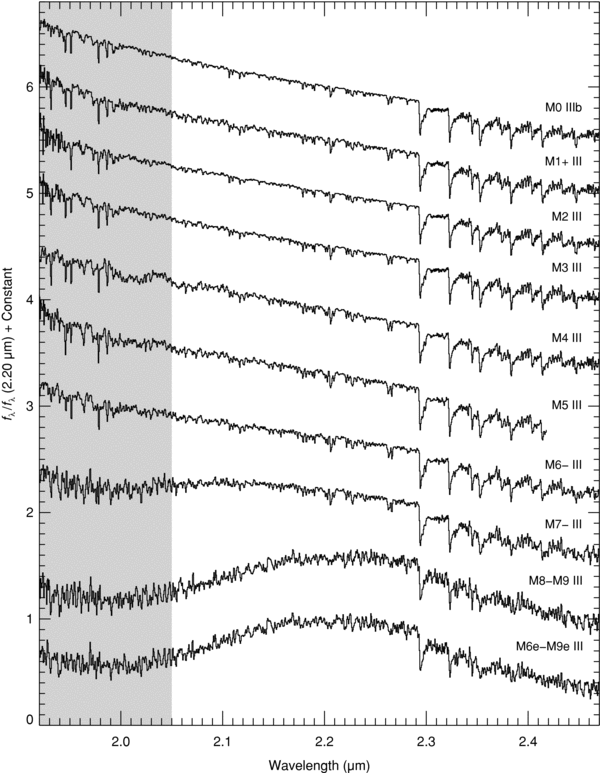
Figure 108. Sequence of M giant stars plotted over the K band (1.92–2.5 μm). The spectra are of HD 213893 (M0 IIIb), HD 204724 (M1+ III), HD 120052 (M2 III), HD 39045 (M3 III), HD 4408 (M4 III), HD 175865 (M5 III), HD 18191 (M6− III), HD 108849 (M7− III), IRAS 21284 − 0747 (M8–M9 III), and HD 69243 (M6e–M9e III). The spectra have been normalized to unity at 2.20 μm and offset by constants.
Download figure:
Standard image High-resolution image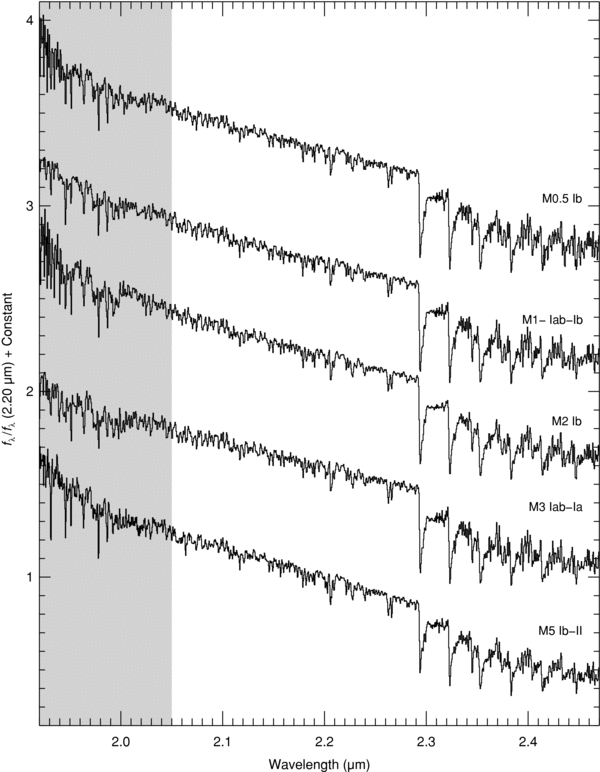
Figure 109. Sequence of M supergiant stars plotted over the K band (1.92–2.5 μm). The spectra are of HD 236697 (M0.5 Ib), HD 14404 (M1− Iab–Ib), HD 10465 (M2 Ib), CD −31 4916 (M3 Iab–Ia), and HD 156014 (M5 Ib–II). The spectra have been normalized to unity at 2.20 μm and offset by constants.
Download figure:
Standard image High-resolution image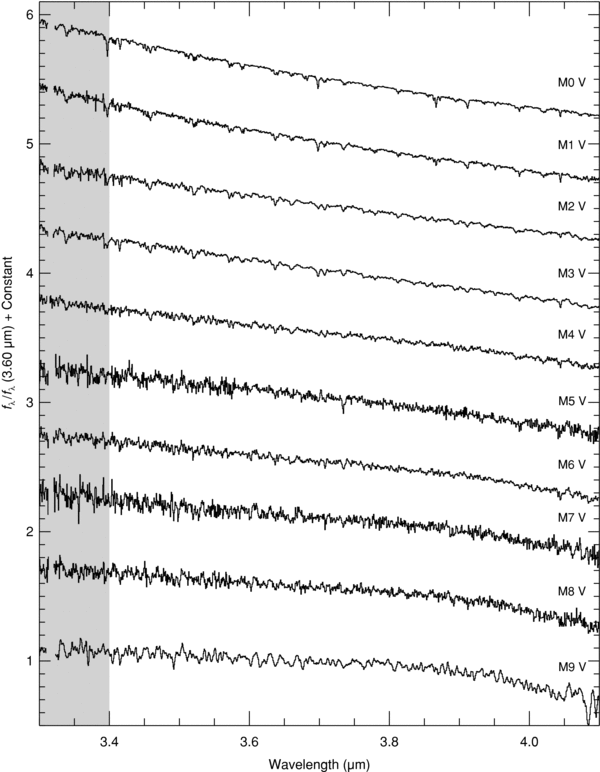
Figure 110. Sequence of M dwarf stars plotted over the L' band (3.6–4.1 μm). The spectra are of HD 19305 (M0 V), HD 42581 (M1 V), HD 95735 (M2 V), Gl 388 (M3 V), Gl 213 (M4 V), Gl 51 (M5 V), Gl 406 (M6 V), Gl 644C (M7 V), Gl 752B (M8 V), and LP944 − 20 (M9 V). The spectra have been normalized to unity at 3.6 μm and offset by constants.
Download figure:
Standard image High-resolution image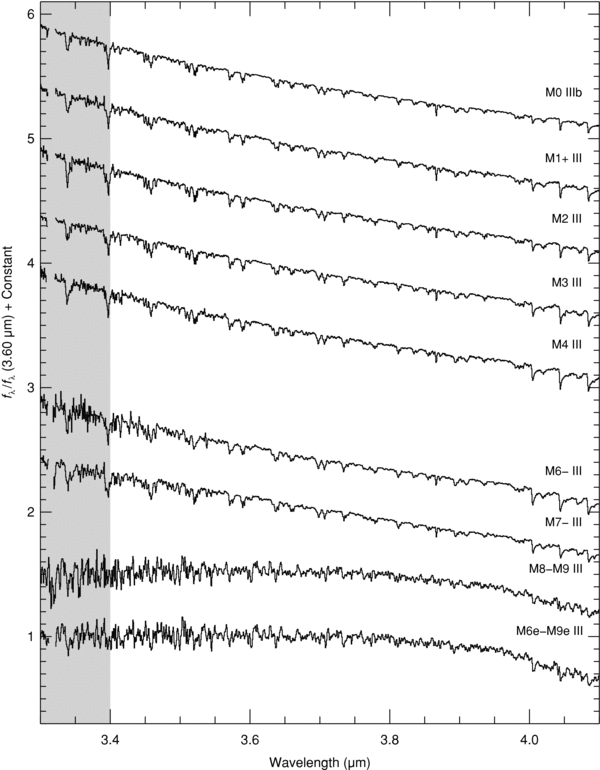
Figure 111. Sequence of M giant stars plotted over the L' band (3.6–4.1 μm). The spectra are of HD 213893 (M0 IIIb), HD 204724 (M1+ III), HD 120052 (M2 III), HD 39045 (M3 III), HD 4408 (M4 III), HD 18191 (M6− III), HD 108849 (M7− III), IRAS 21284 − 0747 (M8–M9 III), and HD 69243 (M6e–M9e III). The spectra have been normalized to unity at 3.6 μm and offset by constants.
Download figure:
Standard image High-resolution image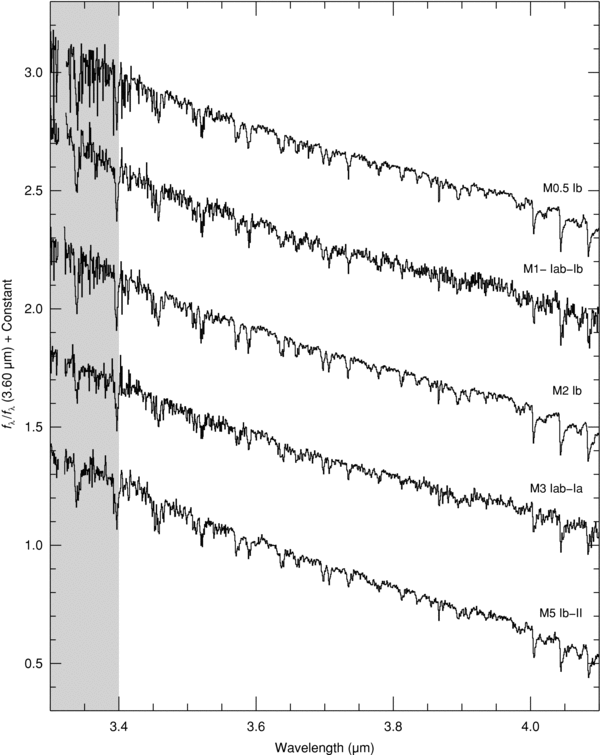
Figure 112. Sequence of M supergiant stars plotted over the L' band (3.6–4.1 μm). The spectra are of HD 236697 (M0.5 Ib), HD 14404 (M1− Iab–Ib), HD 10465 (M2 Ib), CD −31 4916 (M3 Iab–Ia), and HD 156014 (M5 Ib–II). The spectra have been normalized to unity at 3.6 μm and offset by constants.
Download figure:
Standard image High-resolution image
Footnotes
- 4
- 5
- 6
- 7
- 8
- 9
- 10