


ABSTRACT
We present dual-band Herschel/PACS imaging for 59 main-sequence stars with known warm dust (Twarm ∼ 200 K), characterized by Spitzer. Of 57 debris disks detected at Herschel wavelengths (70 and/or 100 and 160 μm), about half have spectral energy distributions (SEDs) that suggest two-ring disk architectures mirroring that of the asteroid–Kuiper Belt geometry; the rest are consistent with single belts of warm, asteroidal material. Herschel observations spatially resolve the outer/cold dust component around 14 A-type and 4 solar-type stars with two-belt systems, 15 of which for the first time. Resolved disks are typically observed with radii >100 AU, larger than expected from a simple blackbody fit. Despite the absence of narrow spectral features for ice, we find that the shape of the continuum, combined with resolved outer/cold dust locations, can help constrain the grain size distribution and hint at the dust's composition for each resolved system. Based on the combined Spitzer/IRS+Multiband Imaging Photometer (5-to-70 μm) and Herschel/PACS (70-to-160 μm) data set, and under the assumption of idealized spherical grains, we find that over half of resolved outer/cold belts are best fit with a mixed ice/rock composition. Minimum grain sizes are most often equal to the expected radiative blowout limit, regardless of composition. Three of four resolved systems around the solar-type stars, however, tend to have larger minimum grains compared to expectation from blowout (fMB = amin/aBOS ∼ 5). We also probe the disk architecture of 39 Herschel-unresolved systems by modeling their SEDs uniformly, and find them to be consistent with 31 single- and 8 two-belt debris systems.
Export citation and abstract BibTeX RIS
1. INTRODUCTION
Building on the initial discoveries of the Infrared Astronomy Satellite (IRAS) in the 1980s (Aumann et al. 1984), observations of circumstellar debris disks using the Spitzer Space Telescope (Werner et al. 2004) and Herschel Space Observatory (Pilbratt et al. 2010) combine to greatly advance our understanding of dust properties, such as its spatial distribution and clues about its composition. Debris disk studies are of greatest interest, because they elucidate the underlying planetary system architecture. The present challenge is to relate disk properties to specific phases in the evolution of planetary systems.
The infrared signatures of hundreds of debris disks around mature stars indicate the presence of asteroidal and/or cometary bodies, whose collisions and/or sublimation create the observed dust. In a few well-studied examples, the rings are shepherded by planets which can create disk offsets (Fomalhaut; Stapelfeldt et al. 2004; Kalas et al. 2008), warps (beta Pic; Mouillet et al. 1997; Lagrange et al. 2009), or large gaps similar to our Solar System (HR 8799; Marois et al. 2008; Su et al. 2009).
The formation of ring belts can be seen as early during the lifetime of stars as in young transitional disks. Observation from the Atacama large millimeter/sub-millimeter array (ALMA) around the transitional disk of Oph IRS 48, shows evidence of dust traps in the disk, leading to the formation of rings centered on the star (van der Marel et al. 2013).
Studies of more mature circumstellar debris systems using the infrared spectrograph (IRS; Houck et al. 2004) and multiband imaging photometer (MIPS; Rieke et al. 2004) onboard Spitzer, observing from 5 to 70 μm, have often revealed warm dust (∼200 K; Morales et al. 2009, 2011) and evidence of multiple radial components (e.g., Hillenbrand et al. 2008; Chen et al. 2009, 2014; Su et al. 2009, 2013; Morales et al. 2011; Ballering et al. 2013).
The photodetector array camera and spectrometer (PACS; Poglitsch et al. 2008, 2010) instrument on the Herschel Space Observatory (Pilbratt et al. 2010), meanwhile, has identified new fainter disks (e.g., Eiroa et al. 2011), and extended the detections toward longer wavelengths—to 70 μm for 22 debris systems in our sample, and 100–160 μm for the rest. Herschel's large 3.5 m primary mirror offers a dramatic improvement in spatial resolution over Spitzer's 85 cm primary, and thus reveals a large number of spatially resolved cold debris disks (Liseau et al. 2010; Matthews et al. 2010; Marshall et al. 2011; Kennedy & Wyatt 2012; Lestrade et al. 2012; Wyatt et al. 2012; Bonsor et al. 2013; Booth et al. 2013; Kennedy et al. 2013), including four systems from our pilot study (Morales et al. 2013).
Here, we discuss a sample of 59 debris systems where Spitzer reveals regions similar in temperature to our asteroid belt and the interior zodiacal cloud (150–250 K; Low et al. 1984; Kelsall et al. 1998). We present Herschel/PACS photometry and combined Spitzer/Herschel spectral energy distribution (SED) analysis, where the new long-wavelength measurements help constrain the debris disk properties. We focus our modeling efforts on the 18 systems where Herschel spatially resolves the extent of the outer dust distribution. These resolved systems provide us with a rare opportunity to help breach the degeneracy between grain properties and their radial position from the star. The combined spectral/spatial information allows us to probe the nature of the cold dust—such as whether the composition is rocky or icy, or the grains are porous.
Beyond the grain composition, resolving the outer/cold dust location also provides a direct measure of disk architecture and serves as reference for the unresolved systems. Robust estimates of dust radial locations will benefit future exoplanetary searches, with the expectation that planets might reside between the dust belts, as in HR 8799 (Su et al. 2009) and in our own Solar System.
In Section 2, our sample selection and the Herschel data are described. We present our dust model in Section 3, as well as the optical grain properties adopted. Section 4 describes the principal results for resolved disks—that icy grains best describe the SEDs of most spatially resolved debris systems in our sample, and that the minimum grain sizes may vary from the expected blowout limits (in general, smaller for SEDs with spectral features, and larger for the solar type stars). In Section 5, we describe spatially unresolved debris systems detected by Herschel. We compare against results from other studies in Section 6, and comment on individual sources. In Section 7, we summarize our findings.
2. THE HERSCHEL DATA
2.1. Sample and Observing Strategy
Detected and characterized by Spitzer photometry and spectroscopy, a sample of 69 nearby stars with warm excess was compiled by Morales et al. (2009, 2011). We consider here 59 of these stars, 26 with evidence for two spatially separated belts of orbiting dust deduced from detailed SED fitting analysis. The remaining 10 stars are too faint for Herschel detection, or were observed non-optimally as part of a large-scale fast-scan program. Table 1 lists the basic characteristics of our 59 sample stars. Most of the stars are observed by two Herschel observing programs led by PI Morales, but a handful come from other programs for which the data are publicly available. All stars are observed using standard small scan maps with the PACS instrument, with simultaneous observations at 70 (or 100) and 160 μm. Each map consists of two cross-scans, separated in position angle by 40°, resulting in a central region of maximum exposure covering several square arcminutes. In general, the choice of either 70 or 100 μm as the primary observing wavelength depends on whether the system was detected already at 70 μm by Spitzer.
Table 1. Target Stars
| Star Name | Spectral Type | d⋆ (pc) | Age (Myr) | L⋆(L⊙) | Teff (K) | |
|---|---|---|---|---|---|---|
| HD 166 | HIP 544 | K0Ve | 13.7 | 456 | 0.59 ± 0.01 | 5410 |
| HD 1404 | HIP 1473 | A2V | 43.3 | ... | 23.57 ± 0.59 | 8920 |
| HD 10939 | HIP 8241 | A1V | 57.0 | 320 | 25.75 ± 0.78 | 9030 |
| HD 12039 | HIP 9141 | G4V | 42.4 | 40 | 0.90 ± 0.04 | 5670 |
| HD 13246 | HIP 9902 | F8V C | 45 | 260 | 1.60 ± 0.05 | 6180 |
| HD 19668 | HIP 14684 | G0V | 40.2 | 200 | 0.59 ± 0.03 | 5330 |
| HD 23267 | HIP 17549 | A0 | 136.4 | 80 | 31.00 ± 3.06 | 9820 |
| HD 23642 | HIP 17704 | A0V | 110.4 | 125 | 18.49 ± 1.72 | 8820 |
| HD 23763 | HIP 17791 | A1V | 144.9 | 125 | 26.58 ± 3.21 | 8240 |
| HD 24141 | HIP 18217 | A5m | 52.2 | ... | 9.96 ± 0.34 | 7890 |
| HD 24817 | HIP 18481 | A2Vn | 75.4 | 400 | 16.65 ± 0.92 | 8810 |
| HD 28355 | HIP 20901 | A7V | 49.2 | 625 | 17.63 ± 0.62 | 7590 |
| HD 30422 | HIP 22192 | A3IV | 57.5 | 10 | 8.29 ± 0.28 | 7820 |
| HD 32977 | HIP 23871 | A5V | 53.2 | 850 | 16.63 ± 0.68 | 8400 |
| HD 37286 | HIP 26309 | A2III-IV | 56.6 | ... | 7.60 ± 0.29 | 8060 |
| HD 38056 | HIP 26796 | A0V | 132.5 | 250 | 51.44 ± 3.39 | 10200 |
| HD 38206 | HIP 26966 | A0V | 69.2 | 9 | 22.38 ± 1.00 | 9680 |
| HD 43989 | HIP 30030 | G0 | 49.8 | 120 | 1.32 ± 0.06 | 5990 |
| HD 60737 | HIP 37170 | G0 | 38.3 | 430 | 1.03 ± 0.04 | 5760 |
| HD 61005 | HIP 36948 | G8Vk C | 34.5 | 220 | 0.55 ± 0.02 | 5440 |
| HD 70313 | HIP 41152 | A3V | 51.4 | 300 | 12.66 ± 0.44 | 8300 |
| HD 71722 | HIP 41373 | A0V | 71.1 | 100 | 15.57 ± 0.49 | 8870 |
| HD 72687 | HIP 41967 | G5V | 45.7 | 280 | 0.88 ± 0.03 | 5680 |
| HD 74873 | HIP 43121 | A1V | 61.1 | 100 | 12.64 ± 0.80 | 8380 |
| HD 79108 | HIP 45167 | A0V | 115.2 | 320 | 42.52 ± 3.53 | 9680 |
| HD 80950 | HIP 45585 | A0V | 80.8 | 80 | 27.65 ± 0.97 | 9840 |
| HD 85301 | HIP 48423 | G5 | 32.2 | 630 | 0.73 ± 0.02 | 5510 |
| HD 87696 | HIP 49593 | A7V | 27.9 | 900 | 9.40 ± 0.19 | 7890 |
| HD 90905 | HIP 51386 | F5 | 31.6 | 440 | 1.42 ± 0.05 | 6010 |
| HD92536 | HIP 52160 | B8V | 147.1 | 50 | 76.89 ± 5.29 | 11020 |
| HD 93738 | HIP 52815 | B9.5V | 143.9 | 50 | 49.90 ± 3.52 | 9700 |
| HD 98673 | HIP 55485 | A7Vn | 78.2 | 1000 | 12.41 ± 0.57 | 8030 |
| HD 104860 | HIP 58876 | F8 | 47.9 | 200 | 1.28 ± 0.04 | 5910 |
| HD 107146 | HIP 60074 | G2V | 28.5 | 350 | 1.02 ± 0.03 | 5850 |
| HD 110411 | HIP 61960 | A0V | 36.9 | 10 | 11.79 ± 0.31 | 8540 |
| HD 115892 | HIP 65109 | A2V | 18.0 | 350 | 21.84 ± 0.25 | 9140 |
| HD 118972 | HIP 66765 | K0Vk: | 15.6 | 399 | 0.41 ± 0.01 | 5120 |
| HD 125283 | HIP 69995 | A2Vn | 68.5 | 100 | 15.43 ± 0.74 | 8630 |
| HD 126135 | HIP 70455 | B8V | 155.5 | 15 | 43.69 ± 4.97 | 10610 |
| HD 128207 | HIP 71453 | B8V | 128.5 | 15 | 121.69 ± 10.55 | 12010 |
| HD 132238 | HIP 73341 | B8V | 191.9 | 15 | 116.37 ± 18.50 | 11050 |
| HD 136246 | HIP 75077 | A1V | 143.5 | 15 | 21.71 ± 2.78 | 8510 |
| HD 136482 | HIP 75210 | B8/B9V | 124.5 | 15 | 37.07 ± 3.67 | 10530 |
| HD 138965 | HIP 76736 | A1V | 77.3 | 100 | 12.40 ± 0.50 | 8630 |
| HD 141378 | HIP 77464 | A5IV | 49.2 | 150 | 11.31 ± 0.33 | 8300 |
| HD 142139 | HIP 78045 | A3V | 66.0 | 700 | 17.28 ± 0.77 | 8810 |
| HD 145229 | HIP 79165 | G0 | 33 | 900 | 0.93 ± 0.03 | 5950 |
| HD 145964 | HIP 79599 | B9V | 105.8 | 5 | 27.30 ± 2.03 | 9520 |
| HD 153053 | HIP 83187 | A5IV-V | 50.7 | 800 | 10.59 ± 0.37 | 7820 |
| HD 159170 | HIP 85922 | A5V | 48.4 | 800 | 10.07 ± 0.36 | 7870 |
| HD 159492 | HIP 86305 | A5IV-V | 42.2 | 170 | 10.60 ± 0.29 | 7770 |
| HD 183216 | HIP 95849 | F8.5VFe+04 | 34.7 | 840 | 1.38 ± 0.05 | 5890 |
| HD 183324 | HIP 95793 | A0V | 59.0 | 10 | 13.03 ± 0.57 | 8630 |
| HD 191174 | HIP 98872 | A2II-III | 78.5 | ... | 15.22 ± 0.60 | 8890 |
| HD 192425 | HIP 99742 | A2V | 47.1 | 120 | 18.00 ± 0.56 | 8540 |
| HD 196544 | HIP 101800 | A2V | 54.3 | ... | 16.33 ± 0.67 | 8940 |
| HD 215766 | HIP 112542 | B9V | 79.7 | 100 | 33.39 ± 2.78 | 10070 |
| HD 220825 | HIP 115738 | A0p... | 49.7 | 150 | 21.46 ± 0.72 | 9030 |
| HD 223352 | HIP 117452 | A0V | 44.0 | 100 | 25.63 ± 1.07 | 9530 |
Note. Source of stellar data is NStED and SIMBAD Astronomical Database.
Download table as: ASCIITypeset image
2.2. Data Reduction
The Herschel Interactive Processing Environment, version 10.0.0 (HIPE; Ott et al. 2010) was used to reduce all of the data. Applying a high-pass filter to the images removes instrumental 1/f noise and background structure (i.e., galactic cirrus) on scales larger than the filter widths (66'' at 100 μm, and 102'' at 160 μm). To avoid any source removal from the filtering, we excluded a region within 15'' of each target. We used HIPE's second-level deglitching method to remove outlying flux measurements within each pixel. The final mosaics, oriented in the detector frame, have 1'' pixels for the 70 and/or 100 μm images, and 2'' for the 160 μm images (cf., the native detector pixel sizes of 3 2 and 64). The images of all well-resolved debris systems, rotated such that north is up, are presented in the first columns of Figures 1 (70 μm), 2 (100 μm), and 3 (160 μm).

Figure 1. Herschel images at 70 μm, showing ∼1'-sq regions around the nine of our target stars that are significantly spatially resolved. From left to right, the columns are (1) the original data, (2) the data after subtracting a point-spread function, (3) the original data after subtracting the flux from the central star, (4) an inclined-ring model convolved with the instrument PSF (the model before convolution is shown as a black ellipse), and (5) the residuals when subtracting the model (column 4) from the star-subtracted data (column 3). All images have the same log-stretch scale, and each is oriented with north up and east to the left.
Download figure:
Standard image High-resolution image
Download figure:
Standard image High-resolution image
Figure 2. Herschel images at 100 μm showing ∼1'-sq regions around 15 of our target stars that are significantly resolved. From left to right, the columns are (1) the original data, (2) the data after subtracting a point-spread function, (3) the original data after subtracting the flux from the central star, (4) an inclined-ring model convolved with the instrument PSF (the model before convolution is shown as a black ellipse), and (5) the residuals when subtracting the model (column 4) from the star-subtracted data (column 3). All images have the same log-stretch scale, and each is oriented with north up and east to the left.
Download figure:
Standard image High-resolution image
Download figure:
Standard image High-resolution image
Figure 3. Herschel images at 160 μm, showing ∼1'-sq regions around the 10 star+disk systems that are spatially resolved at this wavelength. From left to right, the columns are (1) the original data, (2) the data after subtracting a point-spread function, (3) the original data after subtracting the flux from the central star, (4) an inclined-ring model convolved with the instrument PSF (the model before convolution is shown as a black ellipse), and (5) the residuals when subtracting the model (column 4) from the star-subtracted data (column 3). All images have the same log-stretch scale, and each is oriented with north up and east to the left.
Download figure:
Standard image High-resolution image2.3. Flux Measurements
Fluxes are measured with aperture photometry. Each source flux is measured within a circular aperture of 5'' radius at 70/100 μm or 10'' at 160 μm, and aperture corrections of 1.77, 2.02, and 1.63, respectively.3 For Herschel/PACS images that are extended (in Section 2.4 below), a larger 10'' aperture is used at 70/100 μm, with aperture corrections of 1.31 and 1.39, respectively. Although this aperture is larger than the size for maximal signal-to-noise ratio (S/N) at 70/100 μm, a smaller (5'') aperture fails to capture all of the extended emission for the resolved systems studied here; the larger aperture yields fluxes that are, on average, 5% higher.
Seven targets (HD 61005, HD 70313, HD 71722, HD 92536, HD 93738, HD 104860, and HD 142139) were observed following a HIFI recovery event, during which time (2012 March 22–23) the Herschel observatory was kept at a relatively warm attitude toward the Sun. Every observation made during this window (2012 March 22–24) suffers from offsets of 159 and 437 in the detector's x- and y-coordinate frame. After accounting for this known problem, the net offsets of these seven stars are mostly less than ∼2'', consistent with pointing jitter observed within the Herschel/DUNES key program (Eiroa et al. 2013). Two exceptions remain unexplained—HD 10939 and HD 191174 (see Table 2). To account for Herschel pointing uncertainty, the target position at 160 μm is set to the 70 or 100 μm centroid.
We measured the uncertainty for each flux in Table 2 directly from the surrounding field variation, by convolving with the selected photometry aperture for each target and applying the corresponding aperture correction. Additionally, systematic calibration uncertainties of 2.64%, 2.75%, and 4.15% for PACS70, PACS100, and PACS160, respectively,4 are also included in the SED fitting, discussed in Section 4. Table 2 lists the resulting photometric flux measurements and uncertainties for the 57 debris systems detected of the 59 target stars in our sample.
Table 2. Herschel Photometry
| Name | 70 μm | 100 μm | 160 μm | |||||
|---|---|---|---|---|---|---|---|---|
| Offseta | Fν (mJy) | Fν/F⋆ | Offseta | Fν (mJy) | Fν/F⋆ | Fν (mJy) | Fν/F⋆ | |
| HD 166b | 09 |
98.0 ± 3.4 | 6.2 | 18 |
67.8 ± 1.8 | 8.8 | 26.5 ± 2.9 | 8.8 |
| HD 1404 | ⋯ | ⋯ | ⋯ | 03 |
30.5 ± 2.4 | 4.0 | 14.7 ± 5.4 | 5.0 |
| HD 10939b | 42 |
381.1 ± 2.2 | 44.8 | 43 |
387.4 ± 2.7 | 92.9 | 239.8 ± 3.9 | 147 |
| HD 12039 | 18 |
15.2 ± 1.2 | 6.4 | ⋯ | ⋯ | ⋯ | 6.6 ± 5.3 | 14.4 |
| HD 13246 | 05 |
22.4 ± 1.1 | 6.8 | ⋯ | ⋯ | ⋯ | 11.9 ± 4.5 | 18.8 |
| HD 19668 | 14 |
7.1 ± 0.8 | 3.6 | ⋯ | ⋯ | ⋯ | 7.7 ± 3.7 | 20.5 |
| HD 23267 | ⋯ | ⋯ | ⋯ | 08 |
7.4 ± 1.4 | 10.3 | −6.7 ± 6.6 | −23.8 |
| HD 23642 | 03 |
8.6 ± 1.5 | 4.6 | ⋯ | ⋯ | ⋯ | 14.8 ± 12.1 | 41.2 |
| HD 23763c | 07 |
4.1 ± 2.6 | 2.1 | −10.5 ± 8.8 | −27.9 | |||
| HD 24141 | 23 |
14.8 ± 1.2 | 2.4 | ⋯ | ⋯ | ⋯ | 5.9 ± 9.5 | 5.0 |
| HD 24817 | 11 |
8.3 ± 0.9 | 2.1 | ⋯ | ⋯ | ⋯ | −4.1 ± 5.0 | −5.5 |
| HD 28355b | ⋯ | ⋯ | ⋯ | 02 |
127.3 ± 14.0 | 20.0 | 45.5 ± 31.2 | 18.3 |
| HD 30422b | 14 |
64.1 ± 3.0 | 14.8 | 09 |
43.3 ± 2.1 | 20.4 | 17.6 ± 3.8 | 21.2 |
| HD 32977 | 15 |
39.8 ± 1.2 | 4.7 | ⋯ | ⋯ | ⋯ | 38.7 ± 13.3 | 23.7 |
| HD 37286 | 11 |
23.1 ± 1.6 | 6.1 | ⋯ | ⋯ | ⋯ | −1.5 ± 6.2 | −2.1 |
| HD 38056 | ⋯ | ⋯ | ⋯ | 11 |
35.5 ± 2.1 | 32.0 | 9.4 ± 5.6 | 21.7 |
| HD 38206b | 06 |
365.1 ± 3.0 | 87.5 | ⋯ | ⋯ | ⋯ | 188.9 ± 6.5 | 236 |
| HD 43989 | 04 |
14.2 ± 1.9 | 5.7 | ⋯ | ⋯ | ⋯ | 3.8 ± 6.7 | 7.9 |
| HD 60737 | ⋯ | ⋯ | ⋯ | 13 |
21.4 ± 1.5 | 14.4 | 8.6 ± 3.8 | 14.9 |
| HD 61005b | 04 |
711.0 ± 3.0 | 337 | 02 |
707.2 ± 4.5 | 685 | 473.2 ± 7.2 | 1174 |
| HD 70313b | ⋯ | ⋯ | ⋯ | 03 |
181.3 ± 4.8 | 52.6 | 106.7 ± 3.9 | 79.2 |
| HD 71722b | ⋯ | ⋯ | ⋯ | 14 |
120.5 ± 4.1 | 64.1 | 46.9 ± 8.7 | 63.8 |
| HD 72687 | 04 |
6.0 ± 1.3 | 2.7 | ⋯ | ⋯ | ⋯ | −1.9 ± 4.9 | −4.5 |
| HD 74873b | 15 |
33.8 ± 2.1 | 6.6 | ⋯ | ⋯ | ⋯ | 17.8 ± 6.1 | 18.1 |
| HD 79108 | ⋯ | ⋯ | ⋯ | 25 |
60.9 ± 2.4 | 40.6 | 32.9 ± 5.5 | 56.1 |
| HD 80950 | ⋯ | ⋯ | ⋯ | 04 |
31.6 ± 1.5 | 15.5 | 13.2 ± 4.2 | 16.5 |
| HD 85301d | ⋯ | ⋯ | ⋯ | 20 |
39.4 ± 2.0 | 22.6 | 28.0 ± 4.5 | 41.2 |
| HD 87696 | ⋯ | ⋯ | ⋯ | 08 |
27.2 ± 1.6 | 2.7 | 10.3 ± 3.2 | 2.6 |
| HD 90905d | ⋯ | ⋯ | ⋯ | 11 |
24.0 ± 2.6 | 8.7 | 13.4 ± 5.8 | 12.4 |
| HD 92536 | 14 |
15.7 ± 1.0 | 6.1 | ⋯ | ⋯ | ⋯ | −8.6 ± 5.3 | −17.4 |
| HD 93738c | 13 |
2.8 ± 1.0 | 1.1 | ⋯ | ⋯ | ⋯ | −1.0 ± 10.9 | −2.1 |
| HD 98673 | ⋯ | ⋯ | ⋯ | 24 |
12.2 ± 2.4 | 7.6 | 16.3 ± 4.7 | 26.0 |
| HD 104860b | ⋯ | ⋯ | ⋯ | 15 |
277.1 ± 3.5 | 240 | 243.4 ± 5.2 | 540 |
| HD 107146b | 09 |
750.7 ± 3.6 | 135 | ⋯ | ⋯ | ⋯ | 763.4 ± 11.3 | 720 |
| HD 110411b | 17 |
257.3 ± 2.9 | 22.3 | 14 |
174.6 ± 3.9 | 30.8 | 81.9 ± 4.1 | 37.0 |
| HD 115892 | ⋯ | ⋯ | ⋯ | 12 |
46.2 ± 2.4 | 1.3 | 13.1 ± 7.4 | 1.0 |
| HD 118972 | ⋯ | ⋯ | ⋯ | 03 |
28.6 ± 2.5 | 6.5 | 8.0 ± 5.2 | 4.7 |
| HD 125283 | 03 |
9.1 ± 1.0 | 2.1 | ⋯ | ⋯ | ⋯ | −2.3 ± 4.5 | −2.8 |
| HD 126135 | 17 |
5.3 ± 1.2 | 4.2 | ⋯ | ⋯ | ⋯ | 2.1 ± 6.2 | 8.6 |
| HD 128207 | 03 |
5.8 ± 1.4 | 1.7 | ⋯ | ⋯ | ⋯ | 9.8 ± 13.2 | 15.1 |
| HD 132238 | 10 |
11.6 ± 1.0 | 6.6 | ⋯ | ⋯ | ⋯ | 0.7 ± 5.4 | 2.1 |
| HD 136246d | ⋯ | ⋯ | ⋯ | 02 |
33.6 ± 2.4 | 40.4 | 27.1 ± 5.7 | 83.4 |
| HD 136482 | ⋯ | ⋯ | ⋯ | 11 |
7.6 ± 1.4 | 7.6 | −1.5 ± 4.9 | −3.8 |
| HD 138965b | ⋯ | ⋯ | ⋯ | 05 |
540.3 ± 4.6 | 356 | 290.2 ± 4.5 | 489 |
| HD 141378b | ⋯ | ⋯ | ⋯ | 02 |
192.1 ± 4.1 | 57.3 | 109.0 ± 8.7 | 83.2 |
| HD 142139 | 12 |
27.1 ± 2.0 | 5.6 | ⋯ | ⋯ | ⋯ | 69.2 ± 20.0 | 74.9 |
| HD 145229 | ⋯ | ⋯ | ⋯ | 03 |
56.7 ± 2.3 | 33.2 | 35.8 ± 5.0 | 53.7 |
| HD 145964 | 16 |
9.2 ± 0.9 | 3.0 | ⋯ | ⋯ | ⋯ | 4.7 ± 5.1 | 7.9 |
| HD 153053b | ⋯ | ⋯ | ⋯ | 09 |
202.2 ± 5.0 | 57.8 | 124.9 ± 5.8 | 91.3 |
| HD 159170 | 08 |
19.5 ± 0.9 | 2.5 | ⋯ | ⋯ | ⋯ | 2.8 ± 4.1 | 1.9 |
| HD 159492b | ⋯ | ⋯ | ⋯ | 06 |
137.6 ± 3.5 | 17.5 | 54.6 ± 4.7 | 17.8 |
| HD 183216 | ⋯ | ⋯ | ⋯ | 07 |
21.0 ± 2.6 | 8.0 | 13.6 ± 4.6 | 13.3 |
| HD 183324b | 28 |
44.4 ± 1.9 | 8.5 | 11 |
35.2 ± 2.2 | 13.8 | 25.8 ± 3.6 | 25.9 |
| HD 191174d | ⋯ | ⋯ | ⋯ | 30 |
37.0 ± 4.8 | 20.7 | 36.6 ± 6.5 | 52.5 |
| HD 192425b | ⋯ | ⋯ | ⋯ | 15 |
228.0 ± 4.7 | 44.4 | 149.7 ± 5.7 | 74.7 |
| HD 196544 | ⋯ | ⋯ | ⋯ | 09 |
51.3 ± 2.5 | 15.9 | 25.0 ± 8.0 | 19.9 |
| HD 215766 | ⋯ | ⋯ | ⋯ | 03 |
16.3 ± 1.1 | 6.7 | 11.4 ± 3.1 | 12.0 |
| HD 220825 | 07 |
33.5 ± 0.9 | 3.8 | ⋯ | ⋯ | ⋯ | 9.9 ± 2.7 | 5.8 |
| HD 223352 | ⋯ | ⋯ | ⋯ | 03 |
29.8 ± 2.3 | 4.7 | 17.8 ± 5.1 | 7.2 |
Notes. Ten stars from the original Morales et al. (2011) sample were not observed by Herschel: HIP 345, HIP 682, HIP 30030, HIP 74752, HIP 74824, HIP 75476, HIP 76395, HIP 95560, HE 848, and HII 1101.
aOffset between the observed and nominal target positions. bExcess emission is spatially resolved. cNot enough signal to noise ratio for a Herschel PACS detection at any waveband. dExcess emission is marginally resolved.Download table as: ASCIITypeset image
2.4. Image Analysis for Dust Properties
Image analysis identical to that presented in Morales et al. (2013) is applied to the overall sample. By subtracting the instrument point source function (PSF) from each image, extended emission is readily seen. We use the Herschel observations of the bright calibrator star alf Cet as the reference PSF. The debris disk data and reference PSF were obtained with the same observing strategy (i.e., two cross-scans separated by 40°), and were reduced using the same pipeline script. When projected into the detector frame (and not in the northeast frame, as is standard), the PSF trefoil pattern is always aligned in the same direction. It is then used for analysis, and to produce each final mosaic. Figures 1–3, column two, show the PSF-subtracted images, where the PSF is artificially normalized to the brightest pixel in order to emphasize the extent of surplus disk emission. Extended emission on two sides of the star is expected, e.g., for an inclined disk. For unresolved sources, however, all emission is removed when performing PSF subtraction.
We now consider a simple model for each debris system, by assuming that the emission originates from an inclined ring of orbiting dust surrounding a star. To begin, we subtract the expected emission of the stellar photosphere, estimated from its near-infrared photometry, extrapolated to the Herschel wavebands; the resultant images of excess flux (third column of Figures 1–3) are essentially indistinguishable from the original images (first column), because the star is extremely faint relative to the dust emission.
Next, by varying three ring parameters—radius, inclination, and position angle—we search for the ring model that best matches the excess flux, minimizing the remaining residual emission. The best fit ring model, after convolution with the PACS instrument PSF, is shown in the fourth column of Figures 1–3, for each resolved debris system in our sample (note that the PSF trefoil pattern is evident for each system's image and ring model). Ring models before convolution are included as black ovals within each model image. In the majority of cases, the Herschel/PACS images are consistent with a thin-ring model, as demonstrated by clean residual maps (last column of Figures 1–3). In some cases, however, (e.g., HD 107146), the thin-ring model leaves significant residuals; a wider dust distribution appears necessary to fit the Herschel image, in that case.
Although 18 debris systems are resolved at 70 and/or 100 μm, only 10 disks have an outer edge that is also significantly resolved at 160 μm (Figure 3). Failure to also resolve the other eight debris disks at 160 μm is due to both the intrinsic lower angular resolution at a longer wavelength, and also because of the disks' lower S/N (relatively larger noise for fainter disks), revealing an outer edge to each PACS-160 μm detected dust system.
The best-fit model radius, inclination, and position angle are listed in Table 3 for each of the 18 (14 A-type and 4 solar-type) spatially resolved disks, and at each wavelength. To determine error bars, we vary parameters until the residuals increase by the equivalent of a 1σ point source.
Table 3. Herschel-resolved Disk Sizes
| Name | λ | d⋆ | R | Inc. | P.A. | |
|---|---|---|---|---|---|---|
| (μm) | (pc) | (AU) | ('') | (°) | (°) | |
| HD 166 | 70 | 13.7 | 29 ± 3 | 2.1 ± 0.2 | 21 ± 24 | 106 ± 61 |
| 100 | ⋯ | 36 ± 3 | 2.6 ± 0.2 | 19 ± 16 | N/A | |
| 160 | ⋯ | ... | ... | ... | ... | |
| 160 | ⋯ | ... | ... | ... | ... | |
| HD 10939 | 70 | 57.0 | 158 ± 4 | 2.8 ± 0.1 | 32 ± 4 | 17 ± 10 |
| 100 | ⋯ | 178 ± 4 | 3.1 ± 0.1 | 31 ± 4 | 23 ± 11 | |
| 160 | ⋯ | 210 ± 17 | 3.7 ± 0.3 | 23 ± 16 | 50 ± 52 | |
| 160 | ⋯ | 211 ± 18 | 3.7 ± 0.3 | 29 ± 19 | 34 ± 43 | |
| HD 28355 | 100 | 49.2 | 103 ± 28 | 2.1 ± 0.6 | 76 ± 50 | 95 ± 30 |
| 160 | ⋯ | ... | ... | ... | ... | |
| HD 30422 | 70 | 57.5 | 107 ± 21 | 1.9 ± 0.4 | 31 ± 43 | N/A |
| 100 | ⋯ | 123 ± 16 | 2.1 ± 0.3 | 43 ± 32 | 93 ± 33 | |
| 160 | ⋯ | ... | ... | ... | ... | |
| 160 | ⋯ | ... | ... | ... | ... | |
| HD 38206 | 70 | 69.2 | 170 ± 7 | 2.5 ± 0.1 | 60 ± 4 | 85 ± 4 |
| 160 | ⋯ | 216 ± 57 | 3.1 ± 0.8 | 81 ± 40 | 93 ± 20 | |
| HD 61005 | 70 | 34.5 | 81 ± 2 | 2.3 ± 0.1 | 59 ± 2 | 67 ± 3 |
| 70 | ⋯ | 90 ± 2 | 2.6 ± 0.1 | 64 ± 2 | 59 ± 2 | |
| 100 | ⋯ | 91 ± 2 | 2.6 ± 0.1 | 68 ± 3 | 67 ± 2 | |
| 160 | ⋯ | 93 ± 17 | 2.7 ± 0.5 | 74 ± 24 | 73 ± 17 | |
| 160 | ⋯ | 95 ± 14 | 2.7 ± 0.4 | 75 ± 25 | 78 ± 13 | |
| 160 | ⋯ | 100 ± 14 | 2.9 ± 0.4 | 80 ± 27 | 57 ± 13 | |
| HD 70313 | 100 | 51.4 | 147 ± 11 | 2.9 ± 0.2 | 76 ± 9 | 47 ± 6 |
| 160 | ⋯ | ... | ... | ... | ... | |
| HD 71722 | 100 | 71.1 | 139 ± 27 | 2.0 ± 0.4 | 78 ± 37 | 161 ± 18 |
| 160 | ⋯ | ... | ... | ... | ... | |
| HD 74873 | 70 | 61.0 | 104 ± 30 | 1.7 ± 0.5 | 27 ± 66 | N/A |
| 160 | ⋯ | ... | ... | ... | ... | |
| HD 104860 | 100 | 47.9 | 123 ± 6 | 2.6 ± 0.1 | 54 ± 7 | 1 ± 7 |
| 160 | ⋯ | 166 ± 27 | 3.5 ± 0.6 | 81 ± 25 | 13 ± 15 | |
| HD 107146 | 70 | 28.5 | 86 ± 2 | 3.0 ± 0.1 | 12 ± 4 | N/A |
| 160 | ⋯ | 111 ± 4 | 3.9 ± 0.2 | 11 ± 8 | N/A | |
| HD 110411 | 70 | 36.9 | 100 ± 5 | 2.7 ± 0.1 | 64 ± 5 | 94 ± 5 |
| 100 | ⋯ | 116 ± 10 | 3.1 ± 0.3 | 75 ± 10 | 97 ± 7 | |
| 160 | ⋯ | ... | ... | ... | ... | |
| 160 | ⋯ | 189 ± 51 | 5.1 ± 1.4 | 74 ± 43 | 76 ± 28 | |
| HD 138965 | 100 | 77.3 | 187 ± 6 | 2.4 ± 0.1 | 37 ± 5 | 177 ± 9 |
| 160 | ⋯ | 184 ± 41 | 2.4 ± 0.5 | 51 ± 45 | 164 ± 55 | |
| HD 141378 | 100 | 49.2 | 118 ± 8 | 2.4 ± 0.2 | 15 ± 14 | N/A |
| 160 | ⋯ | 247 ± 58 | 5.0 ± 1.2 | 62 ± 37 | 113 ± 30 | |
| HD 153053 | 100 | 50.7 | 186 ± 12 | 3.7 ± 0.2 | 37 ± 9 | 83 ± 17 |
| 160 | ⋯ | 257 ± 50 | 5.1 ± 1.0 | 63 ± 31 | 102 ± 27 | |
| HD 159492 | 100 | 42.2 | 115 ± 10 | 2.7 ± 0.2 | 40 ± 14 | 3 ± 21 |
| 160 | ⋯ | ... | ... | ... | ... | |
| HD 183324 | 70 | 59.0 | 146 ± 23 | 2.5 ± 0.4 | 2 ± 34 | N/A |
| 100 | ⋯ | 169 ± 36 | 2.9 ± 0.6 | 21 ± 42 | N/A | |
| 160 | ⋯ | ... | ... | ... | ... | |
| HD 192425 | 100 | 47.1 | 228 ± 12 | 4.8 ± 0.3 | 63 ± 5 | 98 ± 5 |
| 160 | ⋯ | 271 ± 42 | 5.8 ± 0.9 | 74 ± 15 | 88 ± 13 | |
Download table as: ASCIITypeset image
To further illustrate extended sources detected by Herschel, the mean radial profiles, as seen by PACS at 70, 100, and/or 160 μm, are shown in Figure 4 for two representative extended debris system in our sample—HD 166 and HD 192425. The dust's measured emission around resolved systems like these is spatially extended and readily observed by comparing its profile to the normalized reference PSF from, e.g., alf Cet.

Figure 4. Mean radial profiles of dust around two sources in our sample, HD 166 and HD 192425, showing the resolved extended emission as seen by Herschel/PACS. The solid lines are the measured mean radial profiles (60° wedge along the major axis used for the inclined system HD 192425); the solid error bars mark the mean position flux at each radial point, and the associated uncertainty. The dashed lines are the radial profiles of a normalized PSF from alf Cet, and the dotted lines are the expected stellar flux. The vertical gray lines are the deconvolved disk model locations that best reproduce the observed emission (fourth column in Figures 1–3, and listed in Table 3). HD 166 is significantly resolved at both PACS 70 and 100 μm, but not at 160 μm, whereas HD 192425 is clearly resolved at 100 and 160 μm.
Download figure:
Standard image High-resolution imageIn summary, of the 18 spatially resolved debris systems, nine are resolved with Herschel/PACS at 70 μm, 15 at 100 μm (where six systems are resolved both at 70 and 100 μm), and ten at 160 μm (all of which are also seen at 70 and/or 100 μm). Our sample break down is summarized in Table 4, and separated by spectral type. Of the 59 Spitzer debris disks originally considered, 57 are detected by Herschel, 26 are two-belt dusty systems, and 18 cold/outer belts are spatially resolved.
Table 4. Break Down of Debris Disk Sample
| Description | A-type | Solar-type | Total |
|---|---|---|---|
| Stars | Stars | ||
| Herschel ≥ 3σ Detections | 42 | 15 | 57 |
| Herschel Upper Limits | 2 | 0 | 2 |
| Original Sample Size: | 59 | ||
| Spatially Resolved | 14 | 4 | 18 |
| Spatially Unresolved | 28 | 11 | 39 |
| Two-belt Debris Systems | 20 | 6 | 26 |
| Single-belt Debris Systems | 22 | 9 | 31 |
Download table as: ASCIITypeset image
3. DUST MODEL
The 57 Herschel photometric detections extend the Spitzer measurements out to 70/100 μm, and out to 160 μm for about half of the sample. As expected from the Spitzer results, the SEDs of all spatially resolved systems are each consistent with two distinct dust temperatures, indicative of two belts of orbiting grains. The cold emission is evidently well-reproduced with a thin-ring model, as per the image analysis of Section 2.4. According to Kennedy & Wyatt (2014), although some two-temperature debris disks around Sun-like stars could arise from size variation of grain temperatures in single narrow belts, it is still more probable that most have multiple spatial components. Thus, we assume that, for all double-belt cases (resolved or unresolved), the thermal flux seen at the Herschel wavelengths (70, 100, and 160 μm) originates predominantly from a cold outer dust belt. We also analyzed the SEDs of spatially unresolved systems, and although the Herschel PACS photometry of spatially unresolved systems (39) are a combination of double and single dust components, the majority (26) are well-fit with a single thermal model.
SED analysis, identical to that presented in Morales et al. (2013), is utilized here to model each debris system as optically thin thermal emission from annuli surrounding a central star. The flux density from a single annulus, as a function of wavelength (λ), is given by
where r is the dust's radial location (r),  (a, λ) is the dust emissivity, Bλ is the Planck function, dn is the surface number density (number of grains per area) of dust grains of radius a, and d is the distance from the Sun to the source. The temperature of the dust (Tdust) is obtained from energy balance arguments (energy received versus emitted; see Morales et al. 2013 for details).
Three major assumptions are made by our disk model. First, we adopt compact spherical grains with a range of dust compositions considered in Section 3.1. Second, we assume that each narrow dust belt, whether in single- or double-belt systems, is given by a Gaussian profile centered at radius r0, and peak geometric cross-section τ0 (perpendicular to the plane of the disk),

where ring width Δr is equal to 0.1 r0, unless otherwise specified.
Third, we assume a power-law grain size distribution,  of slope q = −3.5, the analytic value for a steady state collisional cascade (Dohnanyi 1968). The normalization factor Ca(r) depends on the minimum and maximum grain sizes, amin and amax, at each orbital radius, and is a function of the overall geometric cross-section:

Although the largest grains contribute little to the disk emission in the far-infrared, the smallest grain size is an important constraint that we examine carefully in Section 4.
Overall, each thin ring model has three fitting parameters for a given grain composition: minimum grain size (amin, where amax is fixed at 1 mm), radial location (r0), and the overall normalization (τ0). We initially set the value of amin equal to the blowout size (aBOS; Plavchan et al. 2009). However, for the 18 spatially resolved sources treated here, the radius (r0) of the outer/cold dust belts are established by Herschel, so the free parameters are reduced to two. Subsequently, we also estimate minimum dust mass, as in Morales et al. (2013).
The optical scattering properties for most of the observed debris disks in our sample are not well-constrained, because HST scattered-light images are scarce. When available, albedo calculations of spherical compact grains are inconsistent with HST images of mature debris systems, as seen in Krist et al. (2010, 2012), who measured albedos for HD 207129 and HD 202628 of only 0.05, contrasting with the ∼0.55 derived using Mie theory for astronomical silicates (AstroSil). Although examples of young debris systems like β Pic and au Mic have higher-value albedos, most mature debris systems are considerably darker. For a uniform approach, we fix the dust Bond albedo equal to 0.1—consistent with the median for similar debris disks. Because  , the difference between an albedo of 0.1 and 0.2 produces a relatively small effect (∼3%), that does not influence our overall results.
3.1. Optical Properties of Dust Grains
We explore the emissivity properties, (a, λ), of amorphous astronomical silicates (AstroSil), believed to be one of the fundamental constituents from which the solar system formed. Following the Morales et al. (2013) grain mixtures, AstroSil is combined with pure water ice and "dirty" ice (H2O and NH3 with 10% volume pollution of amorphous Carbon (aC) inclusions), to form icy grains. Table 5 summarizes the different complex optical constants and references used: Draine & Lee (1984) provide the optical constants for AstroSil, Warren & Brandt (2008) for water ice, and Preibisch et al. (1993) for aC and the "dirty" ice mixture.
Table 5. Grain Type Summary Table
| Grain Ingredient | Reference | Description/Comments |
|---|---|---|
| Astronomical Silicates (AstroSil) | Draine & Lee (1984) | Amorphous Astronomical Silicates. |
| Pure Water | Warren & Brandt (2008) | |
| Dirty Water | Preibisch et al. (1993) | A mixture of H2O and NH3 ice with inclusions of aC. |
| Amorphous Carbon (aC) | Preibisch et al. (1993) | Pollutant in "dirty ice" at 10% volume fraction. |
| Grain Type | Description/Comments | |
| (1) AstroSil-only | Homogeneous spherical grain of AstroSil composition only. | |
| (2) IMP, Inclusion-Mantle Particle | Icy matrix with spheroidal inclusions of AstroSil | |
| (a.) water ice matrix | at volume fraction of 50% (f = 0.5) | |
| (b.) dirty ice matrix | f = 0.5 | |
| (3) CMP, Core-Mantle Particle | Cores of AstroSil with icy mantles | |
| (a.) water ice mantle | f = 0.5 | |
| (b.) dirty ice mantle | f = 0.5 | |
| (4) Porous IMP | A matrix of IMP (2b) with vacuum inclusions | |
| (a.) dirty ice + AstroSil matrix (2b above) | f = 0.9 | |
Note. Volume fractions of ice at 10%, f = 0.1, were attempted and discarded due to their insignificant effects on emissivity values, compared to AstroSil-only. We also attempted grains made solely of pure water ice or "dirty" ice only, and found that these could not reproduce the shape of the observed SEDs due to their enhanced inefficiency at λ > ∼100 μm. We tested the effect of very "fluffy" spherical grains (4a) by introducing 90%-volume fraction vacuum inclusions in a dirty icy matrix already polluted (at 50% volume fraction) with AstroSil. We find that the SED of only one debris system, HD 71722, is well-fit with these "fluffy" grains for the Herschel-resolved radial location (∼140 AU) of the cold/outer dust belt, given its narrow shape.
Download table as: ASCIITypeset image
Also as in Morales et al. (2013), we simulate two types of inhomogeneous icy grains: AstroSil particles with icy mantles (CMPs for core-mantle particles), and icy grains with AstroSil inclusions (IMP, here, stands for inclusions-matrix particles); see Figure 5 in Morales et al. (2013). Lastly, we examine the effect of porous spherical grains by adding inclusions of vacuum into an IMP. This "fluffy" material provides the opportunity to increase the minimum size of each grain, i.e., the blowout size, and keep the grain density low.
In the case of IMPs, we examine the effect of AstroSil (or vacuum) inclusions into an ice matrix, employing the effective medium theory (EMT; Bohren & Huffman 1983). For a specified volume fraction of embedded inclusions, the EMT results in an averaged dielectric function for a system of sub-grains with different electromagnetic properties.
A grain's absorption cross-section, as a function of wavelength, is computed using its average dielectric, from the scattering and extinction coefficients (Qabs = Qext − Qsca), in the framework of Mie theory (Bohren & Huffman 1983). Table 5 summarizes and Section 3.2 describes the different grain combinations attempted. Similarly, we compute the absorptivities (or emissivities) for CMPs using Mie theory for coated spheres—amorphous AstroSil cores with icy mantles, with volume fraction (core versus ice) of f = 0.5. Emissivity profiles, as a function of wavelength and grain size for the resultant (a, λ), are shown in our
3.2. Emissivities
To model the thermal emission from dust in outer/cold belts, we consider the following variety of grain compositions, as explored in Morales et al. (2013), and add porosity as a forth possibility.
- 1.Homogeneous AstroSil-only grains.
- 2.Inhomogeneous IMP,
- a.AstroSil inclusions in a matrix of water ice, or
- b.AstroSil inclusions in a matrix of "dirty" ice.
- 5.Inhomogeneous CMP,
- a.AstroSil cores with pure water ice mantles, or
- b.AstroSil cores with "dirty" ice mantles.
- 8.Inhomogeneous Porous IMPs,
- a.Vacuum inclusions in a matrix combination of AstroSil +"dirty" ice.
The icy matrix of case 2, and the icy mantle of case 3 comprise 50% of the grain's volume (f = 0.5). In case 4, we test for porosity by considering the extreme case of a 90% volume fraction of vacuum inclusions in a matrix made of the 50/50 "dirty ice"/AstroSil IMP of case 2b above. We did not attempt vacuum inclusions in grains from case 2a (pure water matrix with AstroSil inclusions) because the model grains already showed a considerable deficiency in long (PACS) wavelength emission, due to the intrinsic properties of pure water. The resultant emissivities for the different compositions proposed above differ enough from each other to provide a significant, observable change in the shape of our SED models (see our
In general, we find that grains of radius ≳3 μm no longer produce spectral features in the mid-infrared Spitzer/IRS spectrum. A large number of small (≲3 μm) grains, however, will generate spectral features at 9.8 and ∼20 μm for AstroSil, where ice features at 3.1 and ∼43 μm are produced by small icy grains. Although featureless for any composition, the larger grains do influence the otherwise Rayleigh–Jeans slope at the Herschel wavebands, by suppressing the flux. Accordingly, grain-sizes can be organized into three generalized regimes: small grains (≲3 μm), able to produce spectral features; middle-sized grains (3 μm ≲ a ≲ 30 μm) that necessarily suppress emission relative to a blackbody over the sampled Herschel wavelengths; and big grains (≳30 μm), blackbody-like in unit emissivity, expected to be present—but with a small contribution to the overall surface area.
Including the optical constants of dirty ice in complex grains to our uniform SED model approach is a step forward in exploring the effect of more realistic grain properties, but not definitive. More robust SED analyses require both thermal and scatter light imaging to pin down the grain populations, as well as allowing for grain size distribution (with power-law slope set to q = −3.5), to differ from the assumed steady state collisional cascade above. Such studies have been carried out for a few individual debris disk sources; e.g., HR 4796A by Rodigas et al. (2015), and β Pic by Ballering et al. (2016). Here, however, we acknowledge that our results from a uniform approach may be modified as more data is included for singular sources, and more realistic grain property calculations become available, i.e., fractal grains, etc.
4. RESULTS FOR RESOLVED SYSTEMS
We first focus on the 18 star-disk systems for which the Herschel PACS data obtained spatially resolve the outer/cold debris, and perform detailed image modeling and SED analysis to advance our understanding of disk architecture, grain size, and composition effects.
Similar to the analysis carried out in Morales et al. (2013), using thermal profiles produced with Equation (1), we χ2 fit each measured SED by including the Spitzer 5–70 μm data and the new Herschel photometry at 70 and/or 100, and 160 μm (where available). Morales et al. (2011) find that the excess emission from 26 debris disk systems, including the 18 Herschel-resolved systems, is well-fit with two thermal components. Therefore, we model the inner/warm (Twarm ∼ 190 K, above the ice sublimation temperature) dust component assuming plain AstroSil particles, with the outer/cold dust belt to match the disk sizes when resolved by Herschel. The grain orbital distances for all inner/warm dust components are unconstrained, and thus, a free parameter in our fit. However, the 18 debris disks for which the outer/cold grains are constrained by the Herschel resolved observations are allowed to vary in radius only within the measured radial uncertainty (for all grain types and combinations in Section 3.2).
Our SED best-fits for the spatially resolved debris systems are shown in Figure 5, with icy IMP grains (blue curves), along with the homogeneous AstroSil-only profiles (in magenta), and the two-belt blackbody fits (green curves) from Morales et al. (2011). We attempt all cases proposed in Section 3.2, and discuss our results below. We summarize the quality of fits in Table 6, and detail the best-fit parameters in Tables 7 and 8.

Download figure:
Standard image High-resolution image
Download figure:
Standard image High-resolution image
Figure 5. SEDs for 18 resolved debris systems. For each target, the top plot presents flux in Janskies versus wavelength in microns, including the contribution from the central star. The bottom plots are photosphere-subtracted excess emission only. For each star-disk system, the blue profiles, corresponding to case 2b, are two-Gaussian-belt fits using AstroSil grains for the inner/warm component (blue small-dashed line), and inhomogeneous inclusion matrix particles (IMPs) for the outer/cold component (blue long-dashed line). The resulting radial locations of the rocky and/or icy grains are fixed to agree with the Herschel-resolved grain locations (±∼5 AU). The two-blackbody fits from Morales et al. (2011) are shown in green (the sum as solid green). We find that the AstroSil-only fits (magenta; case 1) results, in general, "flatter" profiles at their peak (wavelengths between ∼50 and 150 μm), most often under-predicting the Herschel photometry (i.e., they are too small compared to the flux measure in the resolved images). Note that SED profiles using the icy grains (blue curves) have a more pronounced decrease in flux (at λ ≳ 70 μm), compared to the AstroSil-only fits.
Download figure:
Standard image High-resolution imageTable 6. Quality of Fit and Confidence Levels
| Spitzer | Herschel | ||||||||||
|---|---|---|---|---|---|---|---|---|---|---|---|
| 70 μm | 70 μm | 100 μm | 160 μm | Best | |||||||
| Name | Spectral | χAS | χIMP | χAS | χIMP | χAS | χIMP | χAS | χIMP | Δχ2 | Grain |
| Type | ( ) ) |
Model | |||||||||
| HD 166 | K0Ve | 6.9 | 3.5 | 8.9 | 1.5 | 8.7 | 2.5 | −0.3 | −2.2 | 176.2 | IMP |
| HD 10939 | A1V | 2.0 | 1.6 | −0.7 | −0.9 | 3.5 | −3.1 | 3.7 | 0.1 | 17.6 | IMP |
| HD 28355 | A7V | 2.5 | 1.7 | ... | ... | 0.8 | 0.5 | ... | ... | 3.7 | IMP |
| HD 30422 | A31V | 10.7 | 11.3 | 0.9 | 1.0 | −2.9 | −0.8 | −2.7 | −1.3 | 1.4 | Inconclusive |
| HD 38206 | A0V | 2.7 | 0.3 | −0.3 | −3.6 | ... | ... | 1.3 | 1.7 | −7.3 | AS |
| HD 61005 | G8Vk+C | 3.5 | −0.2 | 8.3 | 1.5 | 8.6 | 3.0 | 0.5 | −2.7 | 136.9 | IMP |
| HD 70313 | A3V | 7.8 | 3.6 | ... | ... | 3.8 | 0.9 | 2.6 | 2.0 | 64.8 | IMP |
| HD 71722 | A0V | 5.4 | 3.1 | ... | ... | 0.3 | 0.8 | −1.7 | −1.0 | 20.2 | IMP |
| HD 74873 | A1V | ... | ... | −0.7 | −0.3 | ... | ... | 1.1 | 1.3 | −0.2 | Inconclusive |
| HD 104860 | F8 | 0.5 | −1.9 | ... | ... | 2.4 | 1.0 | −0.1 | 1.1 | 0.2 | Inconclusive |
| HD 107146 | G2V | −1.1 | −0.7 | −0.1 | 1.9 | ... | ... | 2.2 | 3.2 | −8.3 | AS |
| HD 110411 | A0V | 6.6 | 2.3 | 7.0 | 1.5 | 3.6 | 0.4 | 1.3 | 0.5 | 99.1 | IMP |
| HD 138965 | A1V | 3.7 | 0.3 | ... | ... | 2.4 | 0.4 | 0.0 | 0.2 | 19.4 | IMP |
| HD 141378 | A5IV | 0.7 | 0.7 | ... | ... | −2.1 | 0.4 | −1.2 | 1.6 | 3.2 | IMP |
| HD 153053 | A5IV-V | 0.9 | −3.4 | ... | ... | 2.9 | −2.7 | −0.6 | −0.2 | −9.2 | AS |
| HD 159492 | A5IV-V | 4.7 | 0.1 | ... | ... | 6.8 | 2.5 | 0.0 | −0.2 | 62.2 | IMP |
| HD 183324 | A0V | −1.8 | −1.6 | 0.7 | 1.1 | −1.0 | −0.8 | 1.3 | 1.8 | −1.1 | Inconclusive |
| HD 192425 | A2V | −1.0 | −1.4 | ... | ... | 0.2 | −1.0 | −0.9 | −1.3 | −2.9 | AS |
Note. The quality-of-fit values (χAS and χIMP) are obtained by comparing the measured fluxes at 70, 100, and 160 μm to the model-predicted fluxes from the AstroSil-only fit and the 'dirty' ice IMPs fit profiles, respectively. Positive/negative values indicate that the model fell above/below the observed fluxes. The difference between the squared quality-of-fits (Δχ2 =  ), provides an overall (5-to-160 μm for the A-type stars and 5-to-1300 μm for the F8 HD 104860) confidence level. For about half of the spatially resolved systems in our sample, this statistical test results in ∼99% confidence that the IMP model supercedes the AstroSil-only model. Four systems are only slightly better fit with AstroSil grains. In cases of Δχ2 close to zero, however, a statistical selection remains inconclusive under the modeling assumptions adopted here.
Download table as: ASCIITypeset image
4.1. Grain Composition for Resolved Systems
Under the assumption of idealized spherical grains distributed in narrow dusty belts, ten resolved debris systems (HD 166, HD 10939, HD 28355, HD 61005, HD 70313, HD 71722, HD 110411, HD 138965, HD 141378, and HD 159492) are best fit (Δχ2 > 3.0, Table 6) with a two-belt debris disk model where the inner/warm component is comprised of AstroSil compact grains, and the outer/cold belt of IMPs with a dirty ice matrix. The icy grain model fits (Figure 5, blue curves) best reproduce the observed SEDs, while matching the resolved sizes of the outer/cold dust.
Figure 6 compares the icy versus rocky quality-of-fit χ2 values for photometry of λ ≥ 70 μm, which is dominated by the outer/cold dust emission. Sources above the diagonal dashed line in Figure 6, color coded in blue, have long wavelength SEDs best fit by icy grains, whereas the sources below the dashed line are best explained by rocky emissivities. For a representative source in our sample, the color–color diagram of Figure 7 shows the outer/cold expected behavior as a function of radius (AU) from the central star HD 110411. The measured fluxes of the resolved dust (with stars and warm excess subtracted) is best reproduced by icy grains (IMPs, case 2b in Section 3.2), suggesting a reservoir of icy planetesimals.

Figure 6. A quality-of-fit comparison of the outer dust component of each resolved system, considering the chi-squared values for photometric measurement of λ ≳ 70 μm(see Table 6). Sources above the diagonal dashed line colored in blue have long wavelength (λ ≳ 70 μm) SEDs better fit by icy grains (DI stands for dirty ice—the profile produced by the IMPs above), whereas the sources below the diagonal, dashed magenta line are better explained by rocky (AS for AstroSil profiles). The sources closest to the diagonal dashed line are inconclusive, in terms of grain composition, under our approach—and are equally fit by both icy and rocky grains, for the observed Herschel-resolved grain locations. We note that it is important to focus on the difference between the χ2 values plotted here, and not the absolute values. Take, for example, the debris system around HD 166 (the highest blue dot on this plot, and the first SED plot in Figure 5) the emission of which is measured at 70 μm by both Spitzer and Herschel; the discrepancy in relative calibration at 70 μm, increases both χ2 values, but the icy grain model (blue profile) is clearly a better fit to the shape of the data than the AstroSil (magenta) profile.
Download figure:
Standard image High-resolution image
Figure 7. Color–color diagram for a representative resolved outer/cold disk in our sample. The flux measurements of the outer/cold dust belt around HD 110411 is plotted in black, with cyan error bars within the symbol. Icy grains best reproduce the shape of 10 SEDs, suggestive of a reservoir of icy planetesimals. Blue shades are the expected colors of "dirty" ice IMP grains (50%-volume fraction AstroSil plus 50%-volume fraction "dirty" ice) as a function of radius (AU) from the HD 110411 central star. Magenta shades are the expected colors of rocky (AstroSil) debris, whereas green shades are from blackbody-like grains of unity emissivity.
Download figure:
Standard image High-resolution imageFor four star-disk systems (HD 30422, HD 74873, HD 104860, and HD 183324) in our resolved sample, using only the Spitzer and Herschel measurements, we are not able to select between AstroSil or dirty ice IMPs for the outer/cold belt, because their Δχ2 ∼ 0 (Table 6 and black symbols near diagonal on Figure 6). Although the compositions of these outer/cold dust components remain inconclusive, we use the dirty icy IMPs to estimate minimum dust masses. Unlike most of the other systems in our resolved sample, we note that the excess emission around HD 104860 (F8) continues to rise from the Spitzer 70 μm measurement to the Herschel 100 and 160 μm photometry. If we adopt a wider outer/cold dust belt of  to model the emission, we find a slightly better icy-grain fit to the sub-millimeter data from SCUBA. Because this system is also significantly resolved at Herschel 160 μm—at a somewhat larger radii (∼166 AU versus 123 AU at 100 μm)—we conclude that the the icy-grain model with a wider dust region (
 ) is probably a better description of the outer/cold debris around HD 104860. Another example of a system with cold debris and inconclusive composition (i.e., it may turn out to be icy) is HD 30422. We note that the Δχ2 is driven by the inconsistency in relative calibration between Spitzer/MIPS 70 and Herschel/PACS 70 photometry. The blue curve (IMPs) in Figure 5, clearly best fits the shape of the SED provided by Spitzer/IRS (5–35 μm) and Herschel/PACS (70, 100, and 160 μm) data.
The last four debris systems in our resolved sample (HD 38206, HD 107146, HD 153053, and HD 192425) have Δχ2 < 0 (Table 6, and magenta symbols under the dashed line of Figure 6). Although Δχ2 < 0 favors rocky emissivities, we note that 1) the quality-of-fit test comparison (Figure 6) is not as clear in selecting AstroSil over the icy IMP grains (because the magenta symbols tend to fall close to the diagonal dashed line) when compared to the rest of our resolved sample, and 2) that some of these resolved systems, as is the case for HD 107146 (resolved in scatter light, with a broad radial outflow of dust particles smaller than the radiation pressure limit; Ardila et al. 2004), are more complex than the simple two-belt model approach we take here. Once (sub-)millimeter data are included, the dust emission is not only wider in wavelength range, it also implies a radially broader dust architecture that may require a third dust component, and perhaps different grain populations.
In general, for the sample of the 18 resolved systems studied here, the major problem with the AstroSil-only grains (case 1 in Section 3.2, and magenta curves in Figure 5) is that the "flat" shape of the SED, produced for the outer/cold dust component, poorly matches the long wavelength Spitzer/Herschel photometry; i.e., it severely over- or under-predicts the emission (see χAS and χIMP for 70, 100, and/or 160 μm in Table 6).
4.2. Discarded Grain Compositions
The simple blackbody fits from Morales et al. (2011) (green curves in Figure 5) offer a great assessment of the dust's characteristic temperatures of two-belt systems, but the radial locations of blackbody grains are generally closer to the parent star than those observed by Herschel. The Herschel imaging of resolved systems (Section 2.4) reveals that the outer/cold components can be significantly farther out, up to a factor of ∼4.5 in the case of HD 61005 (Figure 9 and Table 7).
Table 7. Fitting Parameters—Resolved Systems, Part I
| Blackbody Fits | AstroSil-only Fits | AstroSil+IMP Fits | |||||||
|---|---|---|---|---|---|---|---|---|---|
| Name | Spectral | Twarm | Tcold |

|

|

|

|

|

|
| Type | (K) | (K) | (AU) | (AU) | (AU) | (AU) | (AU) | (AU) | |
| HD 166 | K0Ve | 166 | 65 | 1.8 | 11.7 | 1.6 | 39.7 | 1.0 | 32.5 |
| HD 10939 | A1V | 182 | 55 | 15.0 | 166.0 | 12.8 | 184.0 | 14.8 | 160.3 |
| HD 28355 | A7V | 123 | 61 | 16.8 | 68.4 | 23.3 | 128.1 | 21.2 | 129.7 |
| HD 30422 | A31V | 254 | 75 | 6.1 | 69.3 | 4.2 | 133.6 | 5.7 | 124.7 |
| HD 38206 | A0V | 238 | 62 | 10.8 | 159.1 | 8.7 | 168.6 | 9.4 | 166.5 |
| HD 61005 | G8Vk C | 124 | 53 | 3.6 | 19.8 | 3.3 | 94.4 | 3.1 | 66.9 |
| HD 70313 | A3V | 184 | 57 | 11.6 | 121.8 | 6.6 | 150.6 | 8.0 | 145.9 |
| HD 71722 | A0V | 216 | 68 | 13.1 | 131.0 | 9.1 | 144.8 | 9.4 | 139.7 |
| HD 74873 | A1V | 177 | 56 | 15.7 | 155.2 | 8.8 | 119.0 | 11.1 | 126.3 |
| HD 104860 | F8 | 199 | 48 | 2.8 | 49.2 | 4.8 | 137.7 | 4.2 | 132.1 |
| HD 107146 | G2V | 107 | 47 | 6.8 | 35.1 | 13.2 | 96.5 | 13.2 | 96.5 |
| HD 110411 | A0V | 283 | 81 | 7.6 | 92.7 | 4.0 | 127.0 | 7.1 | 131.4 |
| HD 138965 | A1V | 174 | 56 | 16.4 | 156.2 | 16.0 | 185.1 | 17.2 | 184.5 |
| HD 141378 | A5IV | 182 | 58 | 9.5 | 92.4 | 10.0 | 110.2 | 6.6 | 127.9 |
| HD 153053 | A5IV-V | 167 | 60 | 11.3 | 86.9 | 8.4 | 203.0 | 16.6 | 192.4 |
| HD 159492 | A5IV-V | 175 | 78 | 10.3 | 51.6 | 9.8 | 117.9 | 10.3 | 125.2 |
| HD 183324 | A0V | 137 | 57 | 32.3 | 187.7 | 29.0 | 193.7 | 28.4 | 179.8 |
| HD 192425 | A2V | 208 | 58 | 10.3 | 133.3 | 13.3 | 274.1 | 13.0 | 231.4 |
Note. Table summarizing the best SED fitting results for the cases proposed in Section 4. Columns 3 and 4 are the characteristic temperatures of the grains (as in Morales et al. 2011); columns 5 and 6 are the radial locations, assuming blackbody grains in thermal equilibrium with the parent star. Columns 7 and 8 (case 1) are the radial locations obtained when homogeneous particles of AstroSil are used as the only composition, for both inner and outer dust belts. Columns 9 and 10 (case 2b) are the radial locations obtained when AstroSil is assumed to be the composition of the warm/inner dust, and the emissivities of the inhomogeneous inclusion-matrix particles (IMPs), using "dirty" ice, are used for the cold/outer dust component. All radial location estimates have an uncertainty of about ±5 AU.
Download table as: ASCIITypeset image
As in Morales et al. (2013), we discard grains containing pure water ice, i.e., cases 2a and 3a in Section 3.2. Whether in the form of IMPs or CMPs, water ice exceedingly suppresses infrared emission, due to its intrinsic inefficiency at absorbing ∼0.1 to ∼1 μm radiation and emitting at λ ≳ 70 μm. The distinct steepening of the long-wavelength emission suggests that the pure water ice particles considered here are not a likely explanation for the resolved systems being studied.
The CMPs of case 3 in Section 3.2 display emissivities strongly influenced by the mantles of ice, comparable to IMPs (Appendix A in Morales et al. 2013). CMPs with "dirty" ice mantles (case 3b) remain only slightly less efficient than the "dirty" ice IMPs (case 2b), and their influence on the resultant SEDs is small and about equally acceptable. Composition, rather than the internal structure of the compact solid grains modeled here, is a more important factor in reproducing the shape of an SED, so we proceed with "dirty" ice IMPs.
We mostly discard the porous grains of case 4 (Section 3.2), due to (1) the resulting severe flux inefficiency when fitting the SED shape of resolved debris systems, and (2) the disagreement with their spatially resolved dust locations. The exception is HD 71722 (Figure 5), for which the quality of fit from the porous grain profile is comparable to that of the "icy" grain IMP fit, resulting in an SED dust radial location centered around R ∼ 132 AU, in excellent agreement with the resolved measurement of 139 ± 27 AU. Although both fits, porous and "dirty" ice IMPs, for HD 71722 utilize the radiative blowout grain limit as their minimum grain size, amin = aBOS, the only significant difference between them is that the minimum size porous grain is a factor of ∼10 larger than the minimum icy IMP ( for HD 71722).
4.3. Grain Sizes for Resolved Systems
We begin SED modeling, assuming minimum grain sizes are limited by what is expected from radiative blowout arguments for each star-disk system. This initial assumption is a good approach to fit unresolved systems, yet spatially resolved debris belts provide us with an opportunity to characterize the size distribution by varying the minimum grain size to match the grain's observed location. Although dust masses and fractional luminosities estimated from our model fits are comparable to previous results for our sample (Morales et al. 2011, 2013), the minimum grain sizes for most of the resolved systems in our sample have never been measured before. Now, with the disk sizes, we deduce the value amin for 18 spatially resolved debris disks, and compare against the expectation from radiative blowout, aBOS. In Table 8, we list both amin and its ratio to blowout, fMB ≡ amin/aBOS.
Table 8. Fitting Parameters—Resolved Systems, Part II
| Name | Spectral | Lwarm | Lcold | Mwarm | Mcold |

|

|

|

|
|---|---|---|---|---|---|---|---|---|---|
| Type | L⋆ | L⋆ | (MMoon) | (MMoon) | (μm) | (μm) | |||
| HD 166 | K0Ve | 4.7E−05 | 7.5E−05 | 7.1E−06 | 8.9E−03 | 0.3 | 0.4 | 1.0 | 1.0 |
| HD 10939 | A1V | 1.7E−05 | 5.9E−05 | 1.1E−03 | 5.0E−01 | 5.6 | 15.8 | 1.0 | 2.0 |
| HD 28355 | A7V | 8.0E−06 | 1.7E−05 | 1.2E−03 | 6.4E−02 | 5.0 | 5.6 | 1.0 | 1.0 |
| HD 30422 | A31V | 1.0E−05 | 2.3E−05 | 6.1E−05 | 5.3E−02 | 2.2 | 3.2 | 1.0 | 1.0 |
| HD 38206 | A0V | 1.1E−04 | 1.5E−04 | 1.5E−03 | 5.5E−01 | 5.0 | 7.1 | 1.0 | 1.0 |
| HD 61005 | G8Vk C | 1.2E−04 | 2.9E−03 | 1.5E−04 | 2.3 | 1.6 | 2.0 | 5.5 | 5.0 |
| HD 70313 | A3V | 2.0E−05 | 4.6E−05 | 3.2E−04 | 2.1E−01 | 3.2 | 4.5 | 1.0 | 1.0 |
| HD 71722 | A0V | 2.8E−05 | 7.2E−05 | 3.4E−04 | 1.6E−01 | 4.0 | 5.0 | 1.0 | 1.0 |
| HD 74873 | A1V | 2.6E−05 | 7.7E−06 | 4.5E−04 | 1.5E−02 | 3.2 | 4.5 | 1.0 | 1.0 |
| HD 104860 | F8 | 2.3E−05 | 6.4E−04 | 4.0E−05 | 1.9 | 3.5 | 4.5 | 6.5 | 6.0 |
| HD 107146 | G2V | 8.9E−05 | 1.1E−03 | 2.1E−03 | 2.5 | 2.2 | 3.2 | 5.0 | 5.0 |
| HD 110411 | A0V | 1.5E−05 | 3.6E−05 | 8.1E−05 | 5.6E−02 | 2.8 | 4.0 | 1.0 | 1.0 |
| HD 138965 | A1V | 7.8E−05 | 3.2E−04 | 2.3E−03 | 1.3 | 5.6 | 7.9 | 2.0 | 2.0 |
| HD 141378 | A5IV | 1.1E−05 | 4.5E−05 | 1.8E−04 | 1.2E−01 | 5.6 | 11.2 | 2.0 | 3.0 |
| HD 153053 | A5IV-V | 8.0E−06 | 2.9E−05 | 1.1E−03 | 2.5E−01 | 2.8 | 12.6 | 1.0 | 3.0 |
| HD 159492 | A5IV-V | 3.4E−05 | 2.7E−05 | 9.6E−04 | 4.6E−02 | 1.0 | 4.0 | 0.4 | 1.0 |
| HD 183324 | A0V | 7.8E−06 | 6.0E−06 | 1.6E−03 | 4.0E−02 | 8.9 | 12.6 | 3.0 | 3.0 |
| HD 192425 | A2V | 2.7E−05 | 2.2E−05 | 9.0E−04 | 3.4E−01 | 10.0 | 17.8 | 2.5 | 3.0 |
Note. Mass estimates (in lunar masses), assuming a population of grain sizes from amin up to 1 mm. We estimate Mwarm and Mcold for each star's best fit model (AstroSil for the warm/inner belts, and dirty ice IMPs for the cold/outer belts), where amin is the minimum grain radius for a given composition (±0.5 μm), fMB is the minimum-to-blowout grain-size factor, and fMB = amin/aBOS.
Download table as: ASCIITypeset image
For the 18 stars considered here, the SED fits to the outer dust components result in minimum grain sizes, amin, that range from ∼0.5 to 15 μm, with a median of ∼5 μm, and uncertainties of ≲0.5 μm. (see Table 8 and Figure 8). We also see considerable variation in grain size relative to blowout. For A-type stars, the SED fit to most outer belts using pure AstroSil or IMP grains have median amin of ∼4.5 μm or ∼6.4 μm, respectively. These sizes are most often equal to the expected blowout sizes, given the density of AstroSil or "dirty ice" IMPs and the properties of each star, i.e., fMB ≈ 1 (Figure 8). The resolved cold debris around three of the four solar-type stars, on the other hand (HD 61005, HD 104860, and HD 107146), tend to have much larger grains relative to what would be expected from blowout (i.e., fMB ≈ 5, 6, and 5 respectively). Solar-type star HD 166, which is well fit with amin = aBOS = ∼0.4 μm, is an exception. Lastly, the SED for HD 159492 requires grains that are smaller than the blowout limit. It needs a factor of  of the blowout size for AstroSil-only (amin ∼ 1.0 μm) to fit the SED of the warm-inner dust component.

Figure 8. Our SED fitting of the 18 spatially resolved debris systems results in minimum grain sizes for the cold-outer belt that range between ∼0.5 and 15 μm, with a median of ∼5 μm. IMPs are plotted in blue, AstroSil in Magenta, and the four inconclusive systems presented here are displayed as black pairs of dots for a given stellar luminosity (left plot); the top and bottom black dots in each of the four pairs correspond to the icy (top) and rocky (bottom) possible minimum grain size. Plotted in cyan, for a few sources, the uncertainties in grain sizes are ≲0.5 μm—most at about the size of the symbol. The magenta and blue dashed lines (left plot), are the theoretical grain sizes expected from radiative blowout arguments, for the AstroSil and "dirty ice" IMP densities, respectively. The gray dashed line is a line fit to the resulting minimum grain sizes (including the median of the black dot pairs for inconclusive sources), which shows that, in general, the minimum grain size is larger than the blowout size for our resolved sample. The minimum-to-blowout factor (right plot), fMB, is unity for the majority of debris disks in our resolved sample (which are also mostly A-type stars), but noticeably larger (fMB = 5 or 6) for three (HD 61005, HD 104860, and HD 107146) of the four resolved later solar-type star-disk systems.
Download figure:
Standard image High-resolution imageThe minimum-to-blowout factor, fMB, has also been deduced for other spatially resolved debris systems with Spitzer/IRS+MIPS 70 μm data of comparable quality. For example, Su et al. (2009) find fMB ∼ 5 for the outer planetesimal belt around the A-type star HR 8799, assuming a grain population of AstroSil. Krist et al. (2010) find fMB ∼ 3 for HD 207129 (G0V), assuming a somewhat steeper slope for the grain size distribution (q = −3.7). Also with a steeper slope, Golimowski et al. (2011) find a minimum grain size for HD 92945 (K1V) that is even larger compared to blowout, fMB > 10.
4.4. Ldust/L⋆ and Mdust for Resolved Systems
The principal results (minimum grain size, dust luminosity, mass) of our SED model fits are listed in Table 8. We find that the dust luminosity ratios for the inner/warm and the outer/cold dust components, Lwarm and Lcold, are generally in the range of 10−5 to 10−4, with the cold component a factor of ∼2.5 more luminous. The exceptions are: (a) HD 159492, HD 183324, and HD 192425, whose two components are comparable in brightness; (b) HD 74873, whose warm component is ∼3.4 times brighter than the cold; and (c) three of the four resolved solar-type stars, HD 61005, HD 104860, and HD 107146, along with two A-type stars, HD 38206 and HD 138965, whose cold components are about an order of magnitude brighter than any others (Lcold ≈ 3 × 10⁻³, 6 × 10⁻⁴, 1 × 10⁻³, 2 × 10⁻⁴, and 3 × 10⁻⁴, respectively).
We also calculate minimum dust masses for each warm/cold component, integrating over all dust sizes from amin up to 1 mm, as in Morales et al. (2013). Dust masses for the warm components are ∼0.1% of a lunar mass (ranging from ∼7 × 10⁻⁶ to ∼4 × 10⁻³ Mmoon; see Table 8). The outer disk always has more dust, typically about a factor of 100 or more. The bright outer disks of the five stars above (Solar-type: HD 61005, HD 104860, and HD 107146; A-type: HD 38206 and HD 138965) are again the outliers, with 2.0, 1.9, 2.2, 0.6, and 1.3 Mmoon of dust. Our minimum dust mass for HD 104860 is comparable to an independent dust mass estimate, based solely on the SCUBA sub-millimeter flux (13 Mmoon; Najita & Williams 2005).
5. RESULTS FOR UNRESOLVED DEBRIS DISKS
We also present dual-band Herschel/PACS imaging for a set of 41 main sequence stars with unresolved excess emission. This sample was previously seen to host warm dust, and is well-characterized with Spitzer spectroscopy (5–35 μm). Of these systems, 39 (28 A-type and 11 solar-type) are detected by Herschel/PACS with a signal-to-noise ≥3σ (Table 2); their disk-size upper limits are summarized in Table 10. The remaining two debris systems, associated with the A-type stars HD 23763 and HD 93738, do not exhibit S/N sufficient for a Herschel/PACS detection at any waveband.
Although about half of the unresolved sample is detected with PACS at 70 μm, and the other half at 100 μm (19 and 20 debris systems are seen at 70 and 100 μm, respectively), only a third (13 unresolved debris disks) are detected (S/N ≥ 3) at 160 μm.

Figure 9. Disk sizes resolved by Herschel, relative to expectation from blackbody emission. Although the large dust grains around A stars (L⋆ ≳ 10 L⊙) have temperatures close to the blackbody approximation, solar-type stars tend to be considerably warmer. In particular, the disk around the dim M star GJ 581 (left-most point) is nine times larger than expectation or, equivalently, the dust is three times hotter than the local blackbody temperature (Lestrade et al. 2012). The overall trend is broadly consistent with the expectation from radiative blowout, where the most luminous stars have the largest grain sizes.
Download figure:
Standard image High-resolution imageWe χ2 fit the SED of unresolved debris systems (Figure 10), using Equation (1) for the thermal emission in the same manner as the resolved systems, but with no restrictions regarding the grain radial locations, and assume amin = aBOS in all cases. Approximately 20% of the unresolved sample of star-disk systems (six A-type and two solar-type) have SEDs that suggest two-ring disk architectures mirroring that of the spatially resolved systems above, and the asteroid–Kuiper Belt geometry of our own solar system. Based on the combined Spitzer/IRS+MIPS (5 to 70 μm), the Herschel/PACS (70 and/or 100 and 160 μm) data set, and under the assumption of idealized spherical grains, the rest of these unresolved sources (31) are best fit with a single thermal component, similar in temperature to the inner/warm components of two-belt systems.

Download figure:
Standard image High-resolution image
Download figure:
Standard image High-resolution image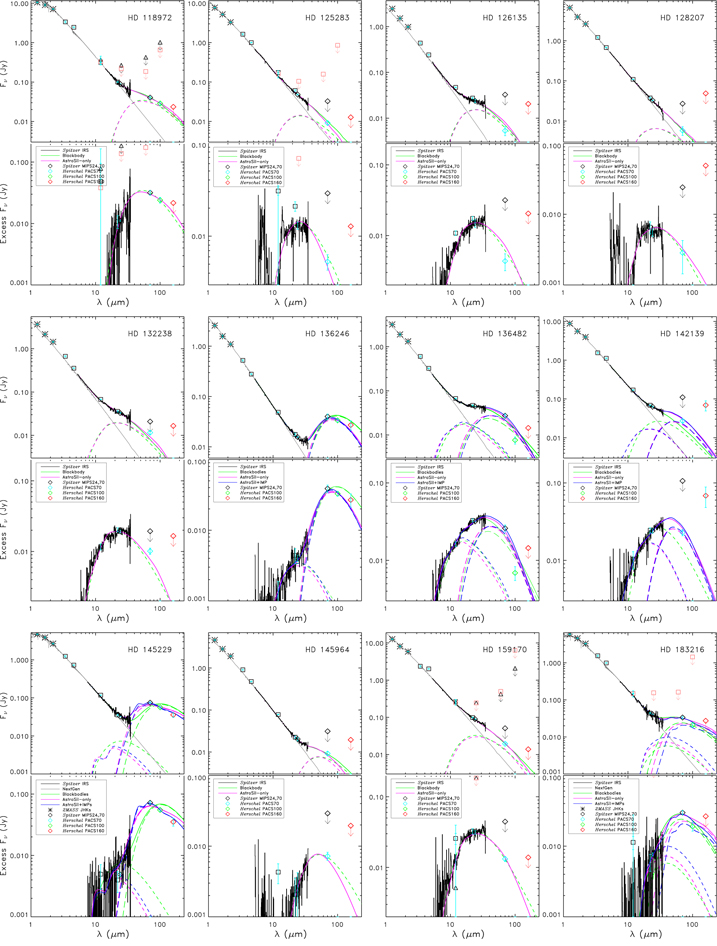
Download figure:
Standard image High-resolution image
Figure 10. Spectral energy distributions for 41 unresolved debris disk systems. Black triangles and red squares are photometry from the IRAS Point Source and Faint Source catalogues, respectively.
Download figure:
Standard image High-resolution image5.1. Grain Sizes for Unresolved Systems
For 41 unresolved debris systems, where the radial extent of the dust is unknown, we begin modeling each SED by assuming minimum grain sizes determined from radiative blowout, amin = aBOS. However, based on SED shape, nine warm single-belt debris systems (HD 24141, HD 24817, HD 37285, HD 87696, HD 132228, HD 159170, HD 215766, HD 220825, and HD 223352) display slightly broader profiles, compared to the AstroSil-only shape, that are closer to a blackbody curve (Figure 10). In our attempt to adopt more realistic grain properties, as opposed to simple blackbody curves, we successfully broaden the shape of the AstroSil curves by increasing the minimum grain size for these systems by a factor of about three in all cases, except for HD 132238. HD 132238 is a main-sequence B8V type star with amin = aBOS ∼ 22 μm—already a large grain, compared to the wavelengths explored—and increasing amin does not make a significant difference in broadening the shape of the SED fit.
To broaden these nine SEDs, we also consider the possibility of a wider unresolved ring ( ), and/or the existence of a faint Kuiper-like component, to reproduce the surplus in flux at the Herschel PACS wavelengths. However, we find that the wider ring fail to reproduce the shape of the SED. Although we do not discard the possibility of a faint outer/cold component, the increase in minimum grain size is an excellent solution to eight of these nine warm debris disk SEDs.
5.2. Grain Composition for Unresolved Systems
We pursue the overall trend of rocky AstroSil grain emissivities for all single-belt and inner/warm components of two-belt SEDs, and attempt both rocky and dirty ice grain emissivities for those with evidence for an outer belt. We find two exceptions to this trend: HD 80950, an 80 Myr old A0V star; and HD 136482, a 15 Myr old B8/B9V star. Both exhibit an SED with two warm components, ∼300 and ∼135 K, for the inner/warm and outer/warm dust belts, respectively. Thus, we fit these two-belt debris system with AstroSil only for the warm dust distributions (Figure 10).
5.3. Ldust/L⋆ and Mdust for Unresolved Systems
Table 9 summarizes the results of our SED model fits; i.e., dust luminosity ratios and minimum dust mass estimates. The median value of the dust luminosity ratios for single-belt systems or inner/warm dust components are similar to the resolved sample; ∼10−5. For those debris systems with a second dust component, the dust luminosity ratios range from 10−6 to 10−4. Their median (∼10−5) is comparable to the inner/warm luminosity ratios, and generally fainter than the outer/cold dust belts of the resolved sample.
Table 9. Fitting Parameters—Unresolved Systems
| Blackbody Fit | Best Grain Fit | ||||||||||
|---|---|---|---|---|---|---|---|---|---|---|---|
| Name | Spectral Type | Twarm (K) | Tcold (K) | Rwarm (AU) | Rcold (AU) | Rwarm (AU) | Rcold (AU) | LwarmL⋆ | LcoldL⋆ | Mwarm (MMoon) | Mcold (MMoon) |
| HD 1404 | A2V | 193 | 68 | 12.0 | 97.2 | 12.5 | 111.2 | 1.1E−05 | 2.5E−06 | 5.0E−04 | 7.1E−03 |
| HD 12039 | G4V | 91 | ... | 4.7 | ... | 17.0 | ... | 1.3E−04 | ... | 5.0E−03 | ... |
| HD 13246 | F8VC | 289 | ... | 3.4 | ... | 3.1 | ... | 2.3E−04 | ... | 6.6E−04 | ... |
| HD 19668 | G0V | 164 | ... | 3.1 | ... | 9.8 | ... | 1.2E−04 | ... | 5.5E−04 | ... |
| HD 23267 | A0V | 180 | ... | 18.7 | ... | 14.7 | ... | 9.8E−05 | ... | 6.0E−03 | ... |
| HD 23642 | A0V | 104 | ... | 56.0 | ... | 21.8 | ... | 5.4E−06 | ... | 6.9E−03 | ... |
| HD 23763 | A1V | 94 | ... | 56.2 | ... | 19.4 | ... | 1.0E−07 | ... | 1.5E−02 | ... |
| HD 24141 | A5m | 215 | ... | 6.8 | ... | 5.5 | ... | 1.6E−05 | ... | 4.2E−04 | ... |
| HD 24817 | A2Vn | 276 | ... | 5.9 | ... | 5.2 | ... | 3.4E−05 | ... | 4.3E−04 | ... |
| HD 32977 | A5V | 188 | 43 | 8.9 | 169.5 | 6.9 | 131.6 | 1.6E−05 | 3.9E−06 | 5.2E−04 | 1.2E−02 |
| HD 37286 | A2III-IV | 187 | ... | 12.8 | ... | 16.2 | ... | 4.2E−05 | ... | 1.2E−03 | ... |
| HD 38056 | A0V | 250 | 78 | 9.8 | 99.8 | 7.6 | 71.4 | 1.1E−04 | 1.5E−04 | 1.5E−03 | 5.5E−01 |
| HD 43989 | G0 | ... | 57 | ... | 8.1 | ... | 33.2 | ... | 6.8E−05 | ... | 9.4E−03 |
| HD 60737 | G0 | ... | 72 | ... | 16.2 | ... | 110.6 | ... | 8.3E−05 | ... | 9.4E−02 |
| HD 72687 | G5V | 136 | ... | 2.1 | ... | 4.4 | ... | 1.1E−04 | ... | 2.9E−04 | ... |
| HD 79108 | A0V | 274 | 74 | 8.1 | 110.7 | 8.4 | 105.4 | 4.0E−05 | 4.0E−05 | 1.4E−03 | 1.8E−01 |
| HD 80950a | A0V | 286 | 136 | 7.5 | 32.8 | 6.3 | 25.9 | 8.1E−05 | 6.0E−05 | 8.3E−04 | 8.2E−03 |
| HD 85301 | G5 | 199 | 67 | 1.7 | 15.0 | 5.0 | 255.9 | 1.2E−04 | 9.2E−05 | 3.4E−04 | 5.2E−01 |
| HD 87696 | A7V | 182 | ... | 7.6 | ... | 25.2 | ... | 9.0E−06 | ... | 5.1E−04 | ... |
| HD 90905 | F5 | 112 | ... | 24.4 | ... | 85.5 | ... | 3.3E−05 | ... | 2.6E−02 | ... |
| HD 92536 | B8V | 250 | ... | 13.6 | ... | 8.1 | ... | 1.1E−04 | ... | 5.7E−03 | ... |
| HD 93738 | B9.5V | 265 | ... | 10.1 | ... | 6.7 | ... | 2.8E−05 | ... | 8.7E−04 | ... |
| HD 98673 | A7Vn | 201 | 60 | 6.3 | 70.7 | 10.1 | 110.4 | 2.6E−05 | 1.1E−05 | 4.0E−04 | 1.7E−02 |
| HD 115892 | A2V | 191 | ... | 12.2 | ... | 16.1 | ... | 6.6E−06 | ... | 2.8E−04 | ... |
| HD 118972 | K0Vk: | 234 | ... | 5.3 | ... | 30.4 | ... | 4.2E−05 | ... | 6.8E−03 | ... |
| HD 125283 | A2Vn | 194 | ... | 11.8 | ... | 23.0 | ... | 1.3E−05 | ... | 4.1E−04 | ... |
| HD 126135 | B8V | 210 | ... | 19.4 | ... | 10.9 | ... | 6.4E−05 | ... | 3.3E−03 | ... |
| HD 128207 | B8V | 193 | ... | 22.8 | ... | 14.6 | ... | 5.2E−06 | ... | 2.5E−03 | ... |
| HD 132238 | B8V | 238 | ... | 15.0 | ... | 8.4 | ... | 1.4E−04 | ... | 5.3E−03 | ... |
| HD 136246 | A1V | 207 | 52 | 11.5 | 180.7 | 11.6 | 231.7 | 1.1E−05 | 3.0E−05 | 4.4E−04 | 3.9E−01 |
| HD 136482 | B8/B9V | 309 | 134 | 8.9 | 47.3 | 4.6 | 32.3 | 7.9E−05 | 4.3E−05 | 6.2E−04 | 1.2E−02 |
| HD 142139 | A3V | 183 | 55 | 11.8 | 131.1 | 5.8 | 46.3 | 1.9E−05 | 1.1E−05 | 2.5E−04 | 7.3E−03 |
| HD 145229 | G0 | 205 | 49 | 2.3 | 39.8 | 3.2 | 161.7 | 3.4E−05 | 1.5E−04 | 2.9E−05 | 2.4E−01 |
| HD 145964 | B9V | 97 | ... | 75.2 | ... | 19.6 | ... | 2.7E−06 | ... | 5.5E−03 | ... |
| HD 159170 | A5V | 209 | ... | 7.2 | ... | 5.9 | ... | 2.1E−05 | ... | 5.9E−04 | ... |
| HD 183216 | F8.5VFe+04 | 127 | 76 | 6.5 | 18.0 | 20.0 | 197.8 | 3.8E−05 | 3.8E−05 | 1.5E−03 | 1.1E−01 |
| HD 191174 | A2II-III | 285 | 64 | 5.5 | 108.4 | 6.2 | 345.4 | 5.1E−05 | 1.7E−05 | 2.5E−04 | 2.0E−01 |
| HD 196544 | A2V | 195 | 69 | 11.8 | 94.4 | 11.1 | 114.6 | 1.9E−05 | 1.7E−05 | 5.4E−04 | 4.1E−02 |
| HD 215766 | B9V | 185 | ... | 20.7 | ... | 15.3 | ... | 3.7E−05 | ... | 5.2E−03 | ... |
| HD 220825 | A0p | 203 | ... | 14.8 | ... | 10.9 | ... | 2.6E−05 | ... | 1.6E−03 | ... |
| HD 223352 | A0V | 191 | ... | 16.7 | ... | 12.3 | ... | 2.3E−05 | ... | 2.4E−03 | ... |
Note. Table summarizing the best SED fitting results for the remaining 41 Herschel-observed debris disks, 39 of which are detected and spatially unresolved systems.
aDebris system with two warm components.Download table as: ASCIITypeset image
The estimated dust masses for the single-belt and inner/warm components are generally within the range of 10−5 to 10−2 Mmoon (see Table 9). Like the resolved two-belt debris disk sample, unresolved systems with a outer/cold component tend to have about a factor of 100 more dust in the outer/cold disk than the inner/warm disk, ranging here from ∼ 7 × 10⁻³ to ∼0.6 Mmoon.
Table 10. Disk-size Upper Limits of Unresolved Systems
| Name | λ | d⋆ | R | |
|---|---|---|---|---|
| (μm) | (pc) | (AU) | ('') | |
| HD 1404 | 100 | 43.3 | <190 | <4.4 |
| HD 12039 | 70 | 42.4 | <109 | <2.6 |
| HD 13246 | 70 | 45.0 | <97 | <2.2 |
| HD 19668 | 70 | 40.2 | <139 | <3.5 |
| HD 23267 | 100 | 136.4 | <466 | <3.4 |
| HD 23642 | 70 | 110.5 | <688 | <6.2 |
| HD 24141 | 70 | 52.2 | <137 | <2.6 |
| HD 24817 | 70 | 75.4 | <232 | <3.1 |
| HD 32977 | 70 | ... | ... | ... |
| HD 37286 | 70 | 56.6 | <122 | <2.2 |
| HD 38056 | 100 | 132.4 | <289 | <2.2 |
| HD 43989 | 70 | 49.8 | <175 | <3.5 |
| HD 60737 | 100 | 38.3 | <81 | <2.1 |
| HD 72687 | 70 | 45.7 | <200 | <4.4 |
| HD 79108 | 100 | 115.2 | <264 | <2.3 |
| HD 80950 | 100 | 80.8 | <150 | <1.9 |
| HD 87696 | 100 | 27.9 | <113 | <4.1 |
| HD 92536 | 70 | 147.1 | <390 | <2.7 |
| HD 98673 | 100 | 78.2 | <413 | <5.3 |
| HD 115892 | 100 | 18.0 | <108 | <6.0 |
| HD 118972 | 100 | 15.6 | <41 | <2.7 |
| HD 125283 | 70 | 68.5 | <230 | <3.4 |
| HD 126135 | 70 | 155.5 | <514 | <3.3 |
| HD 128207 | 70 | ... | ... | ... |
| HD 132238 | 70 | 191.9 | <497 | <2.6 |
| HD 136482 | 100 | 124.5 | <516 | <4.2 |
| HD 142139 | 70 | ... | ... | ... |
| HD 145229 | 100 | 33.0 | <81 | <2.5 |
| HD 145964 | 70 | 105.8 | <320 | <3.0 |
| HD 159170 | 70 | 48.4 | <107 | <2.2 |
| HD 183216 | 100 | 34.8 | <122 | <3.5 |
| HD 196544 | 100 | 54.4 | <112 | <2.1 |
| HD 215766 | 100 | 79.7 | <341 | <4.3 |
| HD 220825 | 70 | 49.7 | <106 | <2.1 |
| HD 223352 | 100 | 44.0 | <184 | <4.2 |
| Marginally Resolved: | ||||
| HD 85301 | 100 | 32.2 | 100 ± 34 | 3.1 ± 1.0 |
| HD 90905 | 100 | 31.6 | 87 ± 27 | 2.8 ± 0.8 |
| HD 136246 | 100 | 143.5 | 359 ± 115 | 2.5 ± 0.8 |
| HD 191174 | 100 | 78.5 | 237 ± 57 | 3.0 ± 0.7 |
Note. Four debris systems are marginally resolved (3.1 to 4.3 σ): HD 85301, HD 90905, HD 136246, and HD 191174.
Download table as: ASCIITypeset image
6. DISCUSSION
6.1. Comparison with Other Herschel-resolved Disks
Several other debris disks have also been imaged by Herschel. Although most of these publications do not entail an SED analysis using icy grain emissivities, each does include a measurement of dust temperature from a blackbody fit to the SED. Combined with the measured disk size, this provides a rough indication of whether the disk emission is dominated by small grains. The key metric we consider is the ratio of the Herschel-observed disk size to that expected from the SED alone, assuming blackbody emission (Rdisk/RBB). If the disk is comprised of small grains, these grains will be hotter than blackbody or, equivalently, the disk size will be larger than expected from the SED fit with blackbody curves. Larger grains will behave more like blackbodies, (a, λ) ≈ 1, with Rdisk/RBB approaching unity.
Figure 9 shows a compilation from many of the published Herschel results (Liseau et al. 2010; Matthews et al. 2010; Marshall et al. 2011; Kennedy et al. 2012; Lestrade et al. 2012; Wyatt et al. 2012; Bonsor et al. 2013; Booth et al. 2013), where disk size relative to expectation from the SED (Rdisk/RBB) is shown as a function of stellar luminosity. There is a general trend apparent; the disks around lower luminosity stars are larger than the blackbody expectation. This is roughly consistent with expectation from blowout; higher-luminosity stars should have relatively large, blackbody-like dust grains, whereas lower luminosity stars should have small super-heated grains. The 18 resolved systems featured in this work (red squares) fall within the overall trend.
6.2. Discussion of Individual Sources
6.2.1. HD 166
The debris system around HD 166—a 456 Myr solar-type (K0Ve) star, at a distance of 13.7 pc—is unusual in some respects. First, it has the smallest spatially resolved outer/cold disk in our sample; i.e., 29 and 36 AU, as seen at 70 and 100 μm, with an inclination of ∼20°. Second, the shape of its long wavelength SED (between 70 and 160 μm) is one of the steepest seen in our sample. That is, the PACS 70 μm photometry, slightly lower than that measured by Spitzer's MIPS 70 μm, is followed by rapidly decreasing flux seen with PACS at 100 and 160 μm. That is, the PACS 70 μm photometry is slightly lower in flux, compared to the MIPS 70 μm measurement, with the PACS 100 and 160 μm decreasing rapidly. We describe this SED shape as indicative of icy material in the outer/cold reservoir. It may require "cleaner" icy particles than the "dirty ice" IMPs used here, for an even steeper model SED fall-off. In addition, HD 166 is the only resolved solar-type star-disk system in our sample well-fit with amin = aBOS; in this case, 0.3 μm for AstroSil in an inner/warm dust component, and 0.4 μm for IMPs in the outer/cold dust belt, given its low stellar luminosity of ∼0.6 L⊙.
6.2.2. HD 10939
HD 10939 (A1V), a 320 Myr old star that lies 57 pc away, has the brightest5 outer/cold emission among the A-type resolved debris disks in our sample. It is also resolved at all PACS wavebands: 70, 100, and 160 μm, with slightly increasing radii as wavelength increases: 158, 178, and 210 AU, respectively. Our best two-belt SED fit results in IMP grains with a size distribution starting at twice that expected from radiative blowout (amin ≈ 2 × aBOS), which, for this bright star (∼26 L⊙), is rather large (∼16 μm for the "dirty icy" IMP grains used here).
6.2.3. HD 28355, HD 30422, HD 70313, HD 71722, and HD 110411
The debris systems around the A-type stars HD 28355 (A7V), HD 30422 (A3IV), HD 70313 (A3V), HD 71722 (A0V), and HD 110411 (A0V), with ages ranging from 10 to 625 Myrs, respectively, are similar in many ways: two-belt SED profiles, outer dust radial locations (∼100 to 140 AU), strong fit with icy IMP grains, fractional luminosities (∼few ×10−5), and dust-mass estimates of less than about 1/10th of a lunar mass for the outer dust component. In general, the SEDs for these five sources have cold emission that peak around the Spitzer and/or Herschel 70 μm photometric point, and steeply fall off in flux at the Herschel 100 and 160 μm wavebands. The minimum inferred grain size around these five A-type star-disk systems is also similar (amin ∼ 4.5 μm), with amin = aBOS for each SED fit.
6.2.4. HD 38206, HD 153053, and HD 192425
Rocky material, or homogeneous AstroSil grains, are a better fit (Table 6) for the outer belt SEDs of the three debris systems around HD 38206 (A0V), HD 153053 (A5IV-V), and HD 192425 (A2V), with ages of 250, 800, and 120 Myr. However, we note that the quality-of-fit test (see Figure 6) for these three systems is not as clear in selecting AstroSil over icy IMP grains when compared to the rest of our resolved sample. The resolved size of the outer belts range from ∼170 to 230 AU at 70 and/or 100 μm. These three sources are also all resolved with Herschel PACS at 160 μm (Figure 3), with ring fits that agree with the sizes seen at the PACS 70 or 100 μm wavebands. The four outer/cold dust components have similar fractional luminosities (∼few × 10−5 to 10−4), and relatively large minimum grain sizes (amin ∼ 7 to 18 μm), for estimated dust masses ranging from about 1/10th to half of a lunar mass.
6.2.5. HD 61005, HD 104860, and HD 107146
Three of our four resolved solar-type star-disk systems: HD 61005 (G8Vk C) 104860 (F8), and HD 107146 (G2V), are extraordinary in some respects. First, the shape of their long wavelength SEDs (between ∼70 and 160 μm) is flatter than that seen around any other debris system in our sample. That is, the PACS photometry is comparable in flux to the Spitzer MIPS 70 μm measurements.
In addition, HD 61005, also known as "The Moth," is resolved in scattered light with Hubble Space Telescope (HST; Hines et al. 2007; Buenzli et al. 2010), exhibiting a ring radius of ∼61 AU, and a bright 350 μm flux (Roccatagliata et al. 2009). More recently, Ricarte et al. (2013) spatially resolved the location of millimeter grains with SMA at 1.3 mm; and although the millimeter observations are not sufficient to distinguish between a wide or narrow belt, they derive a dust location consistent with the scattered light observations. Our Herschel observations of HD 61005 result in a spatially resolved outer/cold dust location of ∼85 to 95 AU from the central star (seen at all PACS wavebands: 70, 100, and 160 μm; see Figures 1–3 and Table 3).
HD 104860 is an exceptional source, the outer disk of which has been detected by Najita & Williams (2005) at 450 and 850 μm with SCUBA, and recently resolved (3-σ) with the Sub-millimeter Array and CARMA at a λ of 1.3 mm (A. M. Hughes 2015, private communication).
The disk around HD 107146 was resolved in scattered light by HST (Ardila et al. 2004; Ertel et al. 2011; Schneider et al. 2014), revealing an unusually broad ring centered around ∼130 AU. In addition to being resolved in the (sub-)millimeter rang, with the James Clerk Maxwell Telescope (Williams et al. 2004), the outer disk of HD 107146 has been detected by Corder et al. (2009) at 1.32 mm, by Hughes et al. (2011) at 880 μm with SMA, and recently by Ricci et al. (2015) at 1.25 mm with ALMA. The ALMA observations constrain the spatial distribution of millimeter-sized grains; Ricci et al. (2015) estimate the disk extends to a distance of ∼25 to 152 AU from the central star, with a possible, marginally resolved, 8 AU gap at the distance of ∼80 AU. The ALMA mean surface brightness profile, as a function of physical separation from the star (Figure 3 in Ricci et al. 2015), shows a double peak shape with maximum emissions at ∼55 and ∼115 AU. Our Herschel observations, at PACS 70 and 160 μm, result in ring fits at ∼86 and 111 AU, respectively. There is, however, a significant surplus of 70 μm flux left in our residual image (see Figure 1); it is clear that the PACS 70 μm emission extends both closer to and farther from the central star than ∼86 AU, with no significant residuals left from the 160 μm ring fit at ∼111 AU.
We use all infrared and (sub-)millimeter photometry in our χ2 fits to help constrain grain sizes and composition for these systems. We find that the cold debris around HD 61005 is clearly best fit with "dirty icy" IMP particles (Figure 5). Although HD 104860 remains inconclusive, the excess from HD 107146 slightly favors the rocky material. The SED fits for these last two systems also require wider outer dust components: Δr of ∼0.3r0 for the outer/cold dust components around HD 104860 and HD 107146.
6.2.6. HD 74873 and HD 183324
HD 74873 (A1V) and HD 183324 (A0V), 100 and 10 Myr old stars, respectively, are similar in that their outer/cold dust emissions have the lowest fractional dust ratios (∼106) of the resolved sample. Spatially resolved with PACS at 70 μm, their outer dust locations lay at ∼104 and 146 AU, respectively, from the central star. Both are equally fit by either rocky and/or icy particles, so we chose to estimate minimum outer dust masses using the lighter IMP particle density, resulting in ∼1% of a lunar mass for each. HD 183324 is different from HD 74873, in that its SED fit requires minimum grain sizes that are about three times larger than expected from the blowout limit (∼4 μm) for these two stars.
6.2.7. HD 138965
The debris system around HD 138965 (A1V), a star 100 Myr in age, is very similar to the five fit with IMPs in Section 6.2.3 above, but differs only in that it has a slightly larger outer belt at ∼185 AU, brighter dust emission Lcold ∼ 3.2 × 10⁻⁴, indicating a dust mass of ∼1.3 Mmoon, and a minimum inferred grain size that is twice its expected blowout size, amin ∼ 8 μm.
6.2.8. HD 141378
HD 141378 (A5IV), 150 Myr old, is also similar to the five in Section 6.2.3, in terms of grain composition, dust luminosity ratio, and dust mass estimate. However, it varies in that its outer disk is slightly smaller (∼120 AU, also resolved at 160 μm; Figure 3), and the minimum grain size is about triple the blowout limit (∼11 μm).
6.2.9. HD 159492
HD 159492, a 170 Myr old A5IV-V type star, is not like the previous resolved star-disk systems, in that (1) the dust luminosity ratios (Lwarm and Lcold) for the two dust components are comparable in brightness (∼3 × 10⁻⁵), and (2) small grains (amin < aBOS) are required to reproduce the spectral structure observed at the Spitzer/IRS wavelengths for the inner/warm component (see insert plot in Figure 5, left-hand side), as well as to reproduce the shape of the SED at the long wavelengths—Spitzer/MIPS70 and Herschel 100/160). The AstroSil emissivities used in our model are for amorphous grains; the faint spectral features from the warm dust around HD 159492 resemble those of the crystalline silicates seen by Chen et al. (2006) around five nearby (A and F-type) debris disk with similar Spitzer data. Another example with spectral features seen with Spitzer/IRS is the debris system around HD 69830 (K0), which reveals an excess emission dominated by strong features attributable to crystalline silicates that are similar to those around comet Hale–Bopp (Beichman et al. 2005). The presence of grains significantly smaller than the blowout size—possibly in crystalline form—may be due to relatively recent cataclysmic collisions among extrasolar planetesimals around HD 159492, reminiscent of the Solar System's late heavy bombardment. Acke et al. (2012) study the debris around Fomalhaut with Herschel, detecting a large amount of small dust grains, and conclude that these are likely produced at a high rate by a collisional cascade of dynamically excited planetesimals.
7. CONCLUSION
We obtained dual-band Herschel/PACS photometry for a set of 59 debris disk stars, for 57 detections—42 A-type and 15 solar-type. Among these, Herschel/PACS spatially resolves the extent of the outer/cold region around 18 debris disk—14 A-type and 4 solar-type—whose SEDs suggest an asteroid–Kuiper Belt-like geometry, as previously inferred from Spitzer IRS and MIPS 70 μm data. To approximate the composite non-uniform internal structure of real grains, we utilize the Maxwell-Garnett EMT and simulate the effects of pollution, aggregation, and porosity on the complex optical constants of the input materials. We determine a grain's emissivity properties in the framework of spherical Mie theory, as in Bohren & Huffman (1983), for homogeneous and inhomogeneous grains. Finally, we calibrate our results with those from the resolved infrared imaging as seen with the  . We find that:
- 1.Herschel/PACS observations at 70 and/or 100 μm detect 57 of the 59 debris disks observed, and spatially resolve the outer/cold dust component for 18 star-disk systems, the majority for the first time.
- 2.The outer edge of 29 debris systems are detected at 160 μm, including all from the resolved sample, but only 10 are significantly resolved at 160 μm.
- 3.Evidence of planetesimals is revealed at ≳100 AU, i.e., larger disk sizes than assumed from simple blackbody fits. The resolved outer/cold dust belts range in size from ∼85 to ∼230 AU, as seen at 70 or 100 μm. A-type systems have a median outer/cold disk size of ∼145 AU, with the solar-type closer to ∼90 AU. An exception is the emission from the dust system around the solar-type star HD 166, with a smaller (yet resolved) outer/cold belt at ∼30 to 35 AU, seen both at 70 and 100 μm.
- 4.All systems with resolved outer/cold dust have SEDs well fit using a two-ring dust model, each ring with a single population of idealized spherical grains: AstroSil-only for the inner/warm unresolved belts, and "dirty" ice IMPs for the outer/cold spatially resolved components for 10 of the 18 resolved systems, provided that the Herschel disk sizes reflect the inner edge of the cold belt and fall under our dust model assumptions; i.e., spherical grains, power-law dust distribution, etc.
- 5.Grain sizes are most often equal to the expected blowout grain limit for debris around A-type stars, as well as for one solar-type star, HD 166, which is well fit with amin = aBOS ∼ 0.4 μm for cold icy grains at the resolved location of ∼36 ± 3 AU. On the other hand, the resolved cold debris around the remaining three solar-type stars—HD 61005, HD 104860, and HD 107146—require a minimum-to-blowout factor of fMB ≈ 5, 6, and 5, respectively. The exception is the debris system around the A-type star HD 159492 showing spectral structure at the Spitzer/IRS wavelengths, and requiring grains a fraction of the blowout limit (
 ).
). - 6.Thirty nine unresolved systems (28 A- and 11 solar-type) are detected by Herschel/PACS; 19 disks at 70, and 20 disks at 100 μm. Eight systems are best modeled with two-ring SEDs.
- 7.Overall, single-belt properties, i.e., Ldust and Mdust, are comparable to the inner/warm dust of two-belt systems. Unresolved outer/cold belts are generally fainter than the outer/cold dust belts of the resolved sample.

Subject to the limitations of our modeling approach, we find that including dirty icy particles is a step forward in exploring realistic grain properties, and the SEDs produced generally well-describe the emission seen from the outer/cold dust belts around two-belt systems. For identical compositions, CMPs and IMPs have very similar emissivity behavior. Thus, composition is a more important factor than the structure of the solid grains modeled here, in reproducing the shape of an SED. We acknowledge that our results may not be definitive, and may be modified as more realistic grain property calculations become available, i.e., fractal grains, etc.
These results, as well as applying our method (of adopting complex grain structures and emissivities) to model a large sample of stars with resolved debris disks, could help address the present degeneracy between grain radius (amin) and dust radial location (r0) in the majority of known debris systems whose dust location has not been resolved.
Along with the 18 well-characterized outer/cold dust components, the majority of the 57 young (<1 Gyr) star-disk systems detected by Herschel also host on-going activity in their terrestrial planet zones. The inner/warm dust belts (Tmedian ∼ 190 K) for these stars are expected to be located at around 10–12 AU from the central A-type stars and ∼3–4 AU from the solar-type stars, assuming AstroSil composition, but these distances have not been resolved. If planets are responsible for the inferred gaps between the inner/warm and outer/cold dust belts, then perhaps these can be identified just inside ∼145 AU (∼27). The high levels of warm and cold excess may also indicate a more massive initial disk that requires more time to grind down, suggesting that more massive planets might have formed in each system. Finally, the strong warm excesses can be an indication of enhanced dynamical stirring, as seen in HD 69830—a triple planet system (Lisse et al. 2007).
The research described in this publication was carried out at the Jet Propulsion Laboratory, California Institute of Technology, under a contract with the National Aeronautics and Space Administration. Herschel is an ESA space observatory, with science instruments provided by European-led principal investigator consortia and important participation from NASA. This work is based (in part) on observations made with the Spitzer Space Telescope, which is operated by the Jet Propulsion Laboratory, California Institute of Technology, under a contract with NASA. This publication makes use of data products from the Two Micron All Sky Survey and the SIMBAD Web site.
APPENDIX: AVERAGE DIELECTRIC CONSTANTS AND EMISSIVITES
Wavelength-dependent refractive indices and extinction coefficients are modeled, as in Morales et al. (2013), to calculate the average dielectric corresponding to each ice mixture proposed in Section 3.2. The absorption cross-section of an aggregate is computed in the framework of Mie theory (page 101; Bohren & Huffman 1983). Figure 11 shows the absorption coefficients, Qabs, as a function of wavelength and particle radii for the "dirty ice" IMP (solid lines) and the porous grain (dashed lines) explored here. For a more detailed discussion of grain properties, i.e., temperature as a function of radial position, size, structure, and composition, see Appendices A and B in Morales et al. (2013).

Figure 11. Emissivity profiles (Qabs) for dirty ice IMPs (solid lines) and porous grains (dashed lines) as a function of wavelength (λ) for various grain sizes labeled in μm. The inclusions matrix particles, modeled in Morales et al. (2013) and plotted here as solid lines, are 50% dirty ice by volume, with 50% inclusions of AstroSil. The porous grains are modeled similarly to the IMPS, where the matrix is 10% of the volume-fraction and composed of the 50/50 IMP combination above. Ninety percent vol-fraction of the porous grains is modeled as vacuum inclusions, making up the porosity. Note the low efficiency in absorption at all wavelengths, which is more pronounced at the shorter optical wavelengths where the parent stars are more efficient. We find that the porous grains fit the SED of the outer/cold belt of one resolved debris system in our sample—HD 71722.
Download figure:
Standard image High-resolution image
Footnotes
- *
Herschel is an ESA space observatory with science instruments provided by European-led Principal Investigator consortia, with important participation from NASA.
- 3
Herschel Release note PICC-ME-TN-037, Table 15.
- 4
Herschel Release note PICC-ME-TN-037, page 23; https://nhscsci.ipac.caltech.edu/sc/index.php/Pacs/AbsoluteCalibration.
- 5
We note that this specific object, HD 10939, suffers from an offset of 4
2 at PACS 70 μm, and 43 at PACS 100 μm, that is yet to be explained. Still, its residuals from a thin-ring model are negligible, and given its thermal flux magnitudes and SED shape, it resembles many of the resolved systems studied here. We have examined the MIPS 24 μm image from Spitzer, showing a clean PSF for a point source that matches the star location to within 1'', with no contaminating sources seen nearby (≲1').